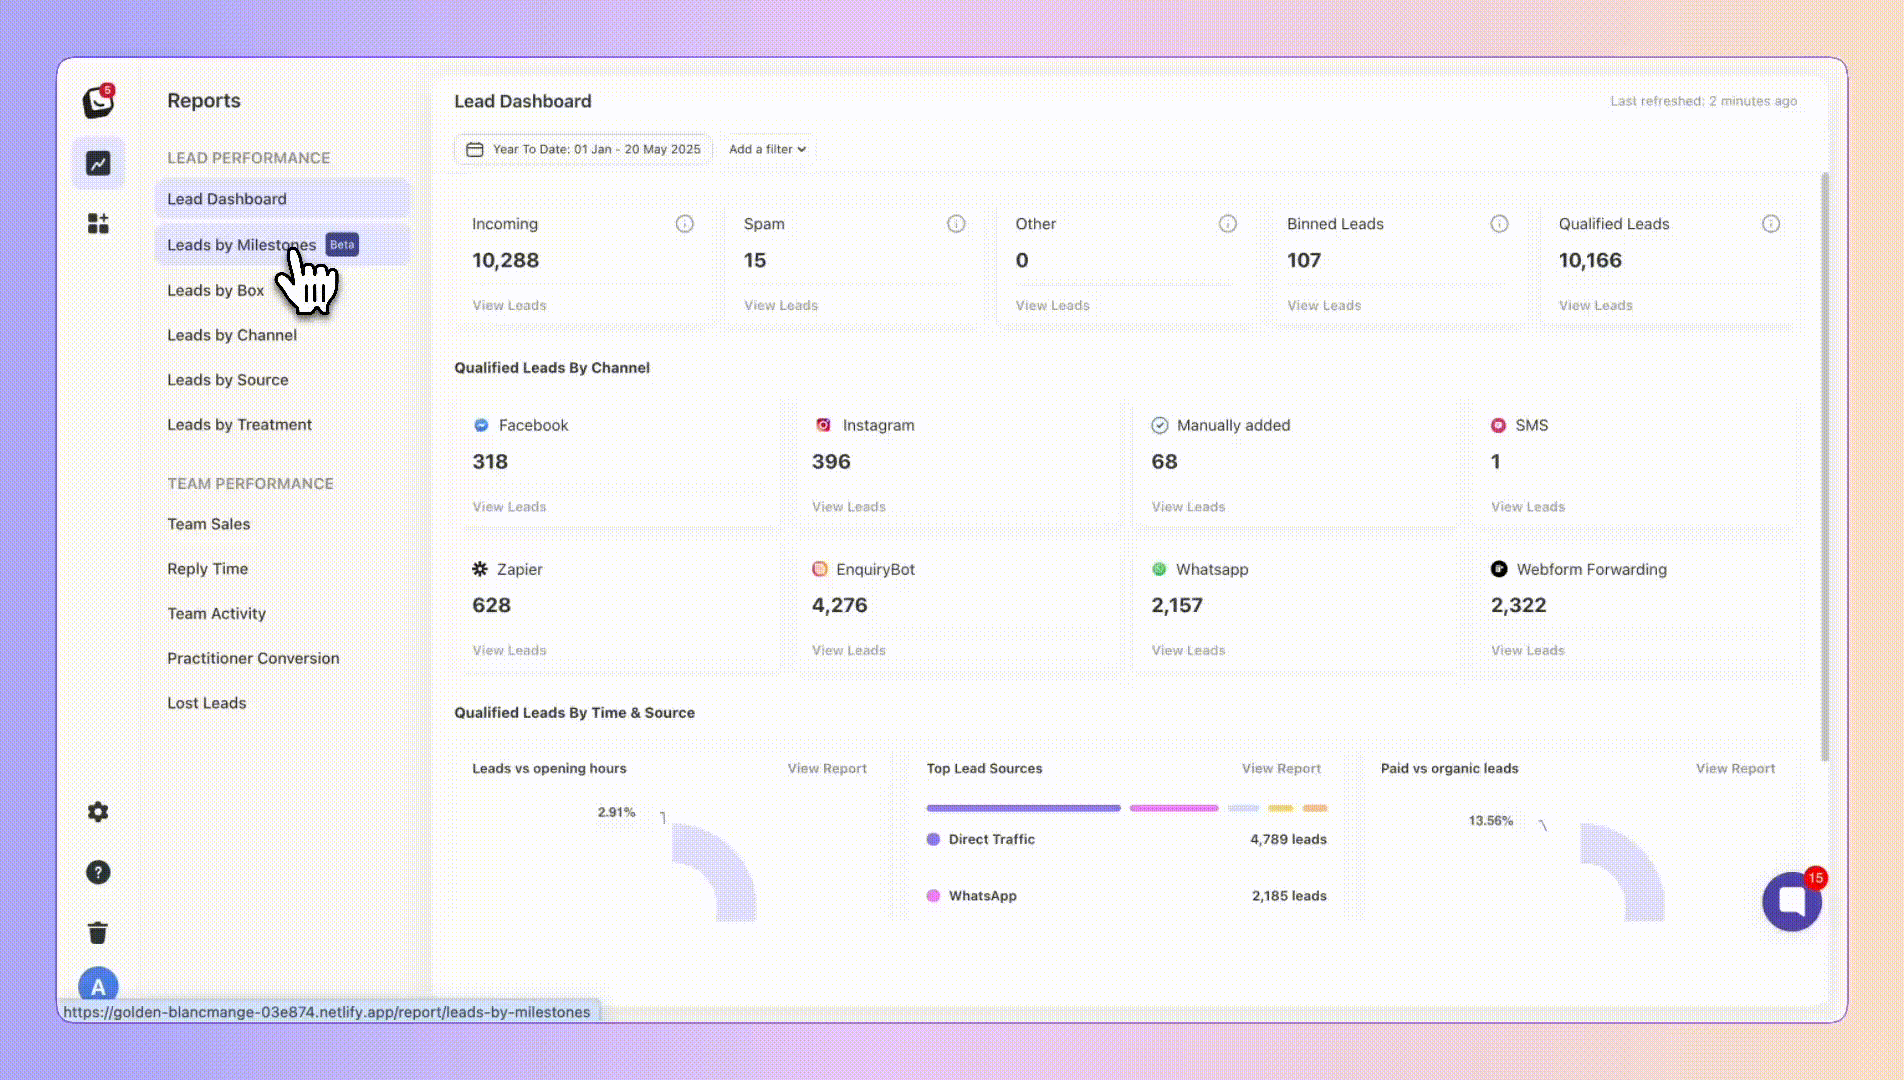
✅ Click on the Reporting icon in your left toolbar
✅ In the dropdown list of reports you’ll see on the left, click into the Milestone Report to explore.
Milestones are a flexible way to track all the meaningful moments that happen in your pipeline, they are the key checkpoints in your sales journey that help you measure lead progression.
They’re tied to your Boxly Stages, so as leads move through your pipeline, Boxly automatically tracks when they pass each milestone.
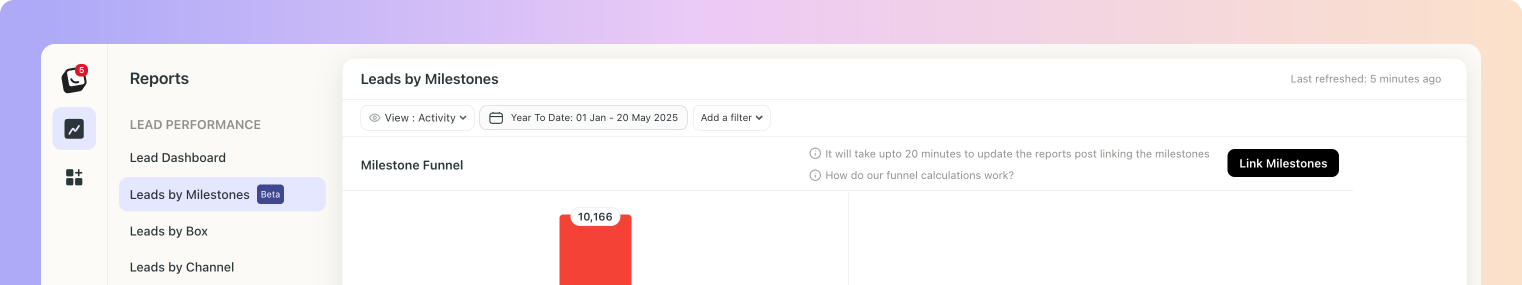
Lead by Milestone Report
Your Lead Milestone report will show the number of leads in each conversion milestone, based on the order you chose in your settings.
By default, the first bar will show "Qualified Leads," and the last bar will show "Lost Reason."
However, you can change the order of the milestones in the settings.
The Qualified leads: displays the number of leads from each Milestone after removing any leads marked as Spam, Other, and Binned from Incoming.
The bar graph will display:
✅ The number of leads in each milestone
✅ The combined last values of the leads before moving out of the milestone.
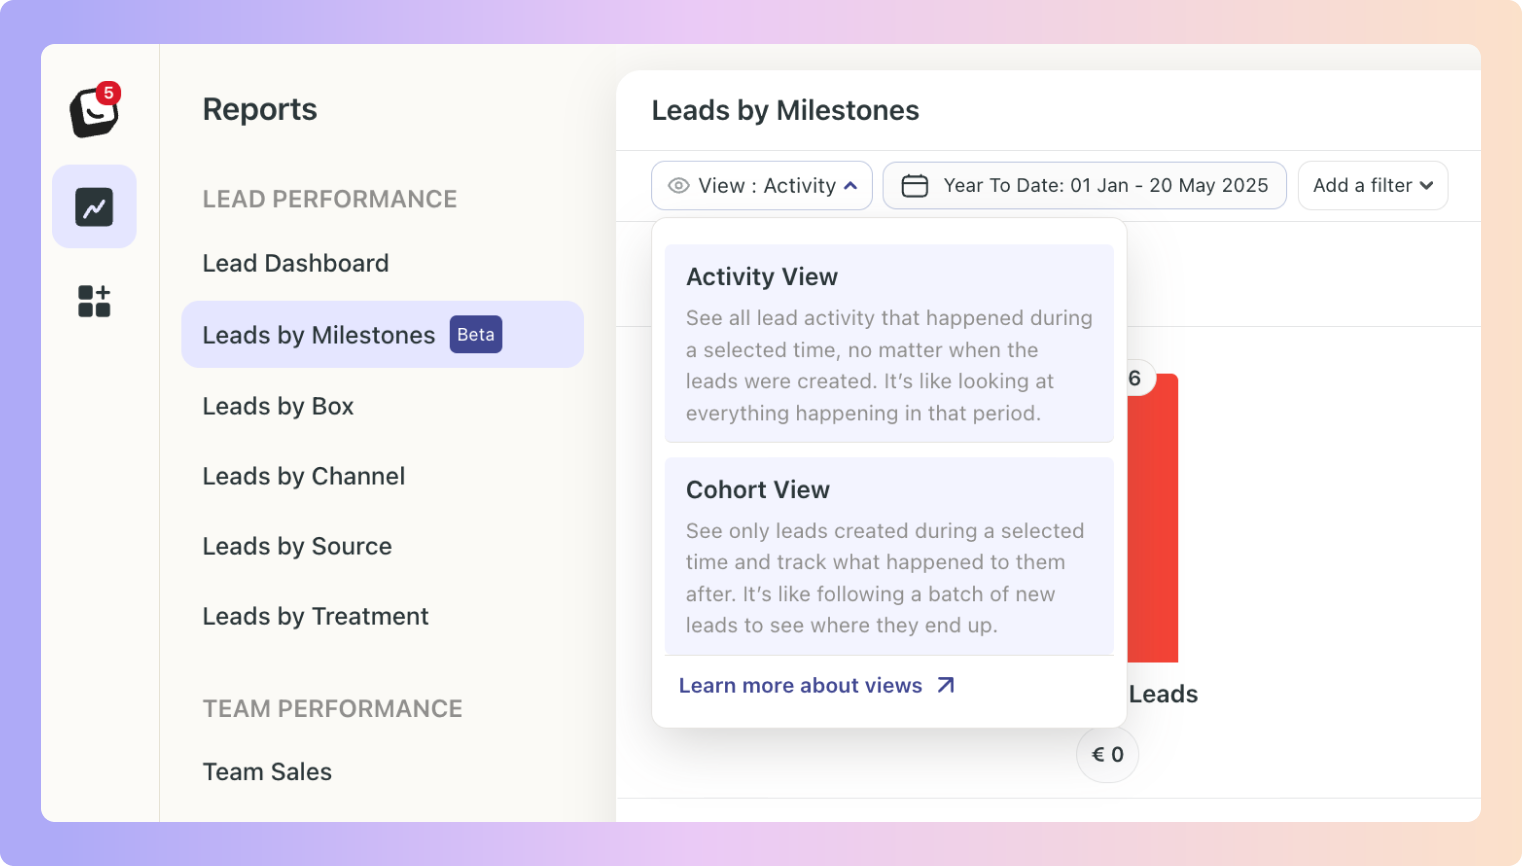
Activity View & Cohort View:
Activity View shows you what happened during a selected time period, like how leads moved, what actions were taken, and how many reached milestones, regardless of when the leads were created.
Cohort View, on the other hand, focuses on leads that came in during a specific period and tracks where they ended up by a later date, helping you understand how long it takes for leads to convert and where they may be getting stuck in the process.
✅ Click on the “View” option at the top of your dashboard to toggle between the two views.
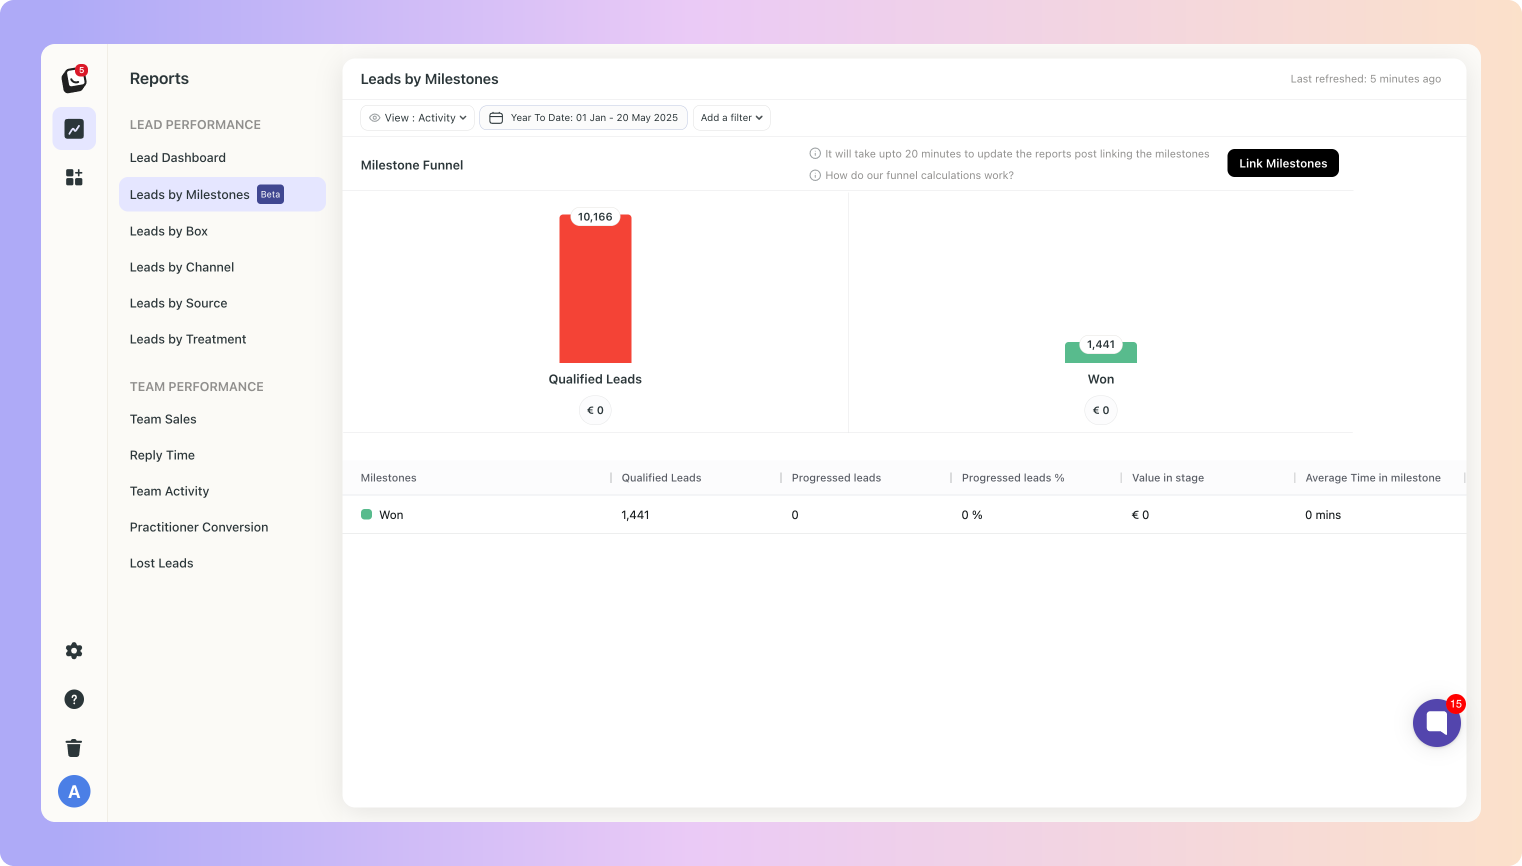
This view will show you what happened during the date range selected.
The data shown is based on the activity that took place for the leads, not based on the leads that came in during that time period.
In this view you can select a ‘starting’ date and a ‘where are we now’ date - a date range to see the number of leads generated during that period. Your ‘where are we now’ date will show where those leads are in terms of stages and milestones on your chosen date.
It doesn’t have to be the current date as the second one (‘where are we now’ date), this view will enable you to track how leads are doing in the process, how long it takes to become a sale and where your stop-gaps are.
For example, selecting January as the date range and February 28 as the "where are they" date will show where leads generated in January are in terms of milestones as of February 28.
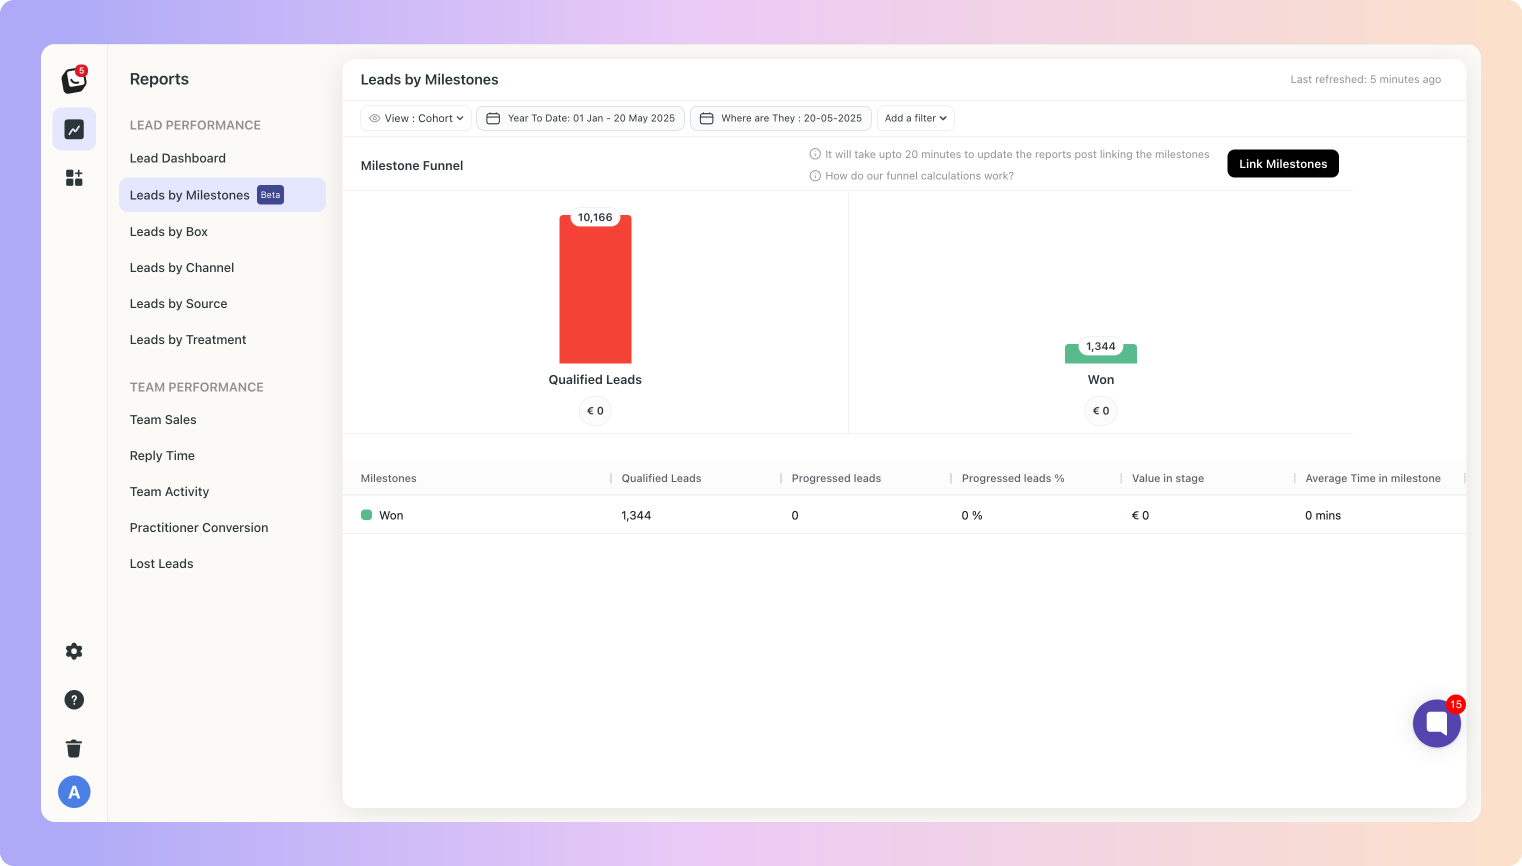
Below the bar graph, a list will display each milestone with the following information:
Number of leads that progressed through each milestone during the selected period
Total value of the leads
Total of last value of leads before leaving the milestone
Average time spent by leads at each milestone
Available filters include User, Channel, Label, Lead source, Box, and Location (if the location plan is active).
✅ Click on “Add a filter”
✅ Select the filter you want applied, like Sources
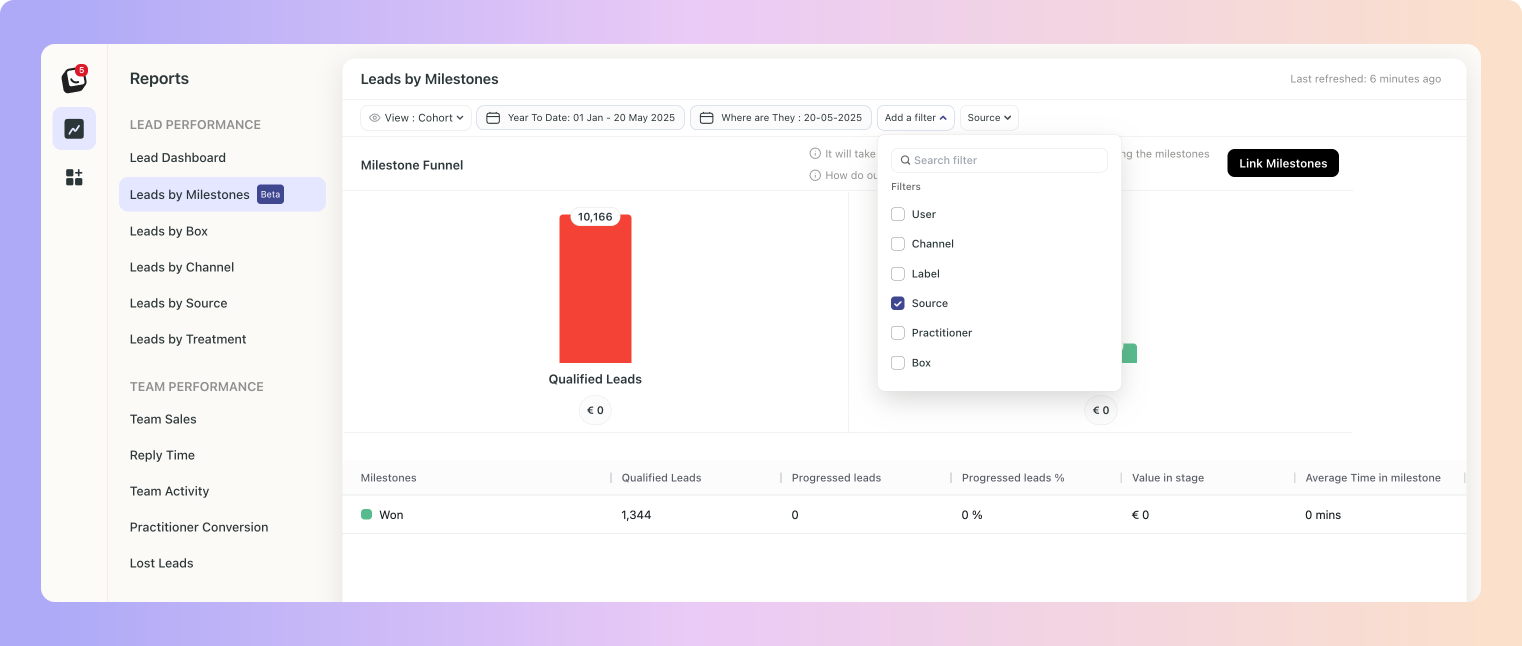
✅ The Filter’s options will appear next to “Add a filter”, select the specific filter within the category you chose. You can choose as many as you want.
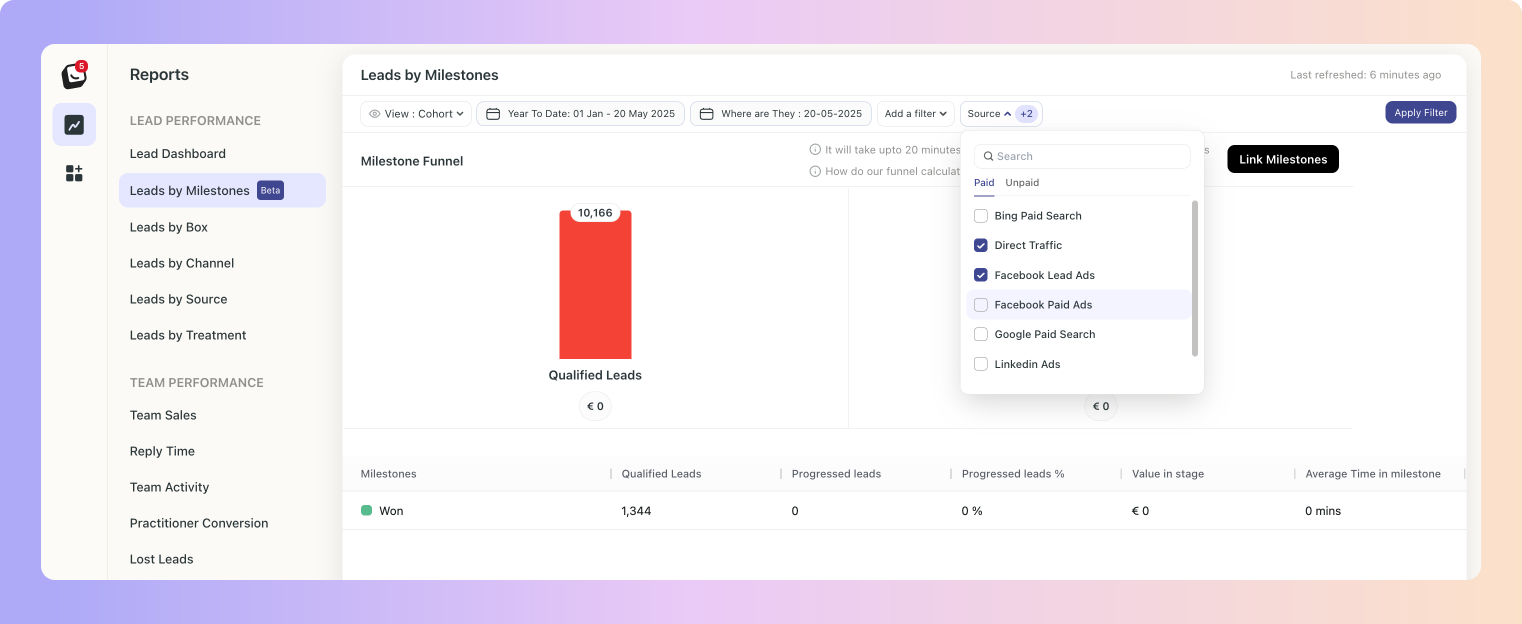
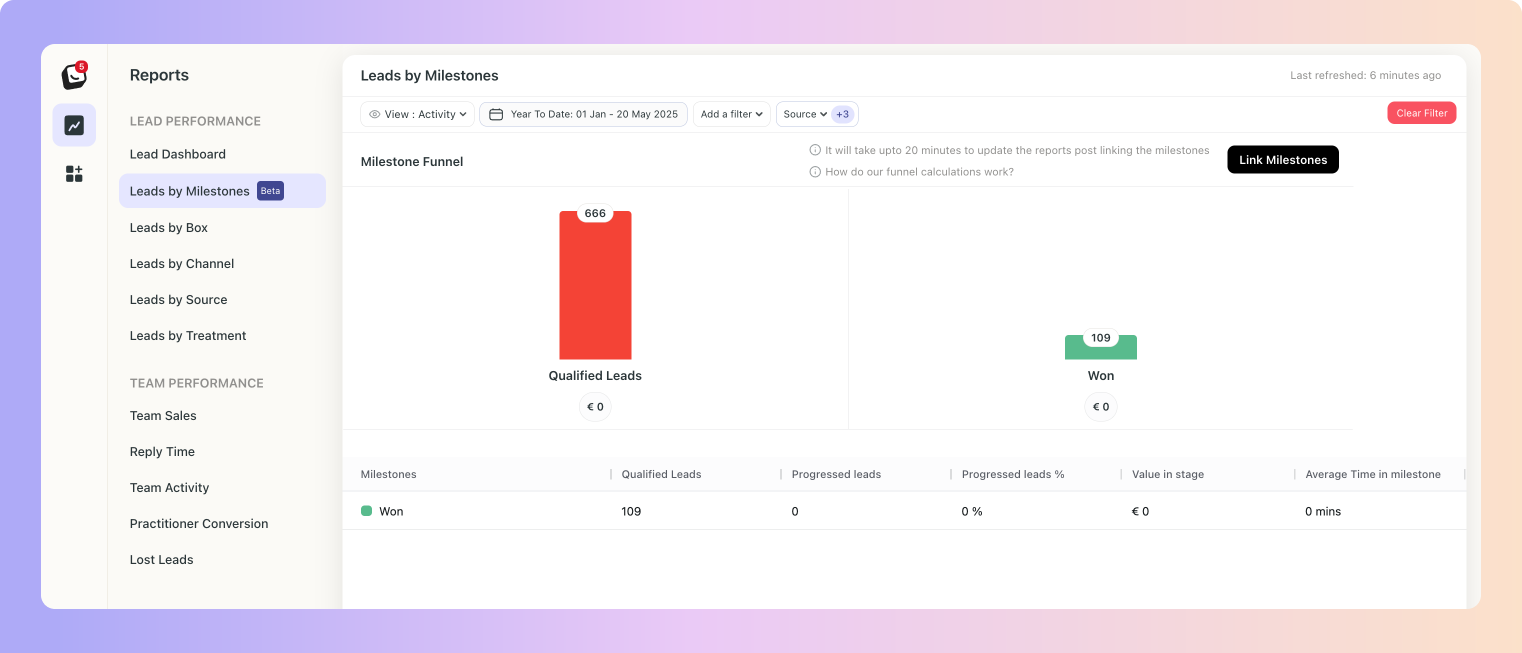
✅ Click “Apply Filter” button on the right and your filter will apply to your report, when you’re done simply click on the red “Clear Filter” button that appears once you’re in a filtered view.
Click on the top left button “Link Milestones” to link your stages right from your reports if needed
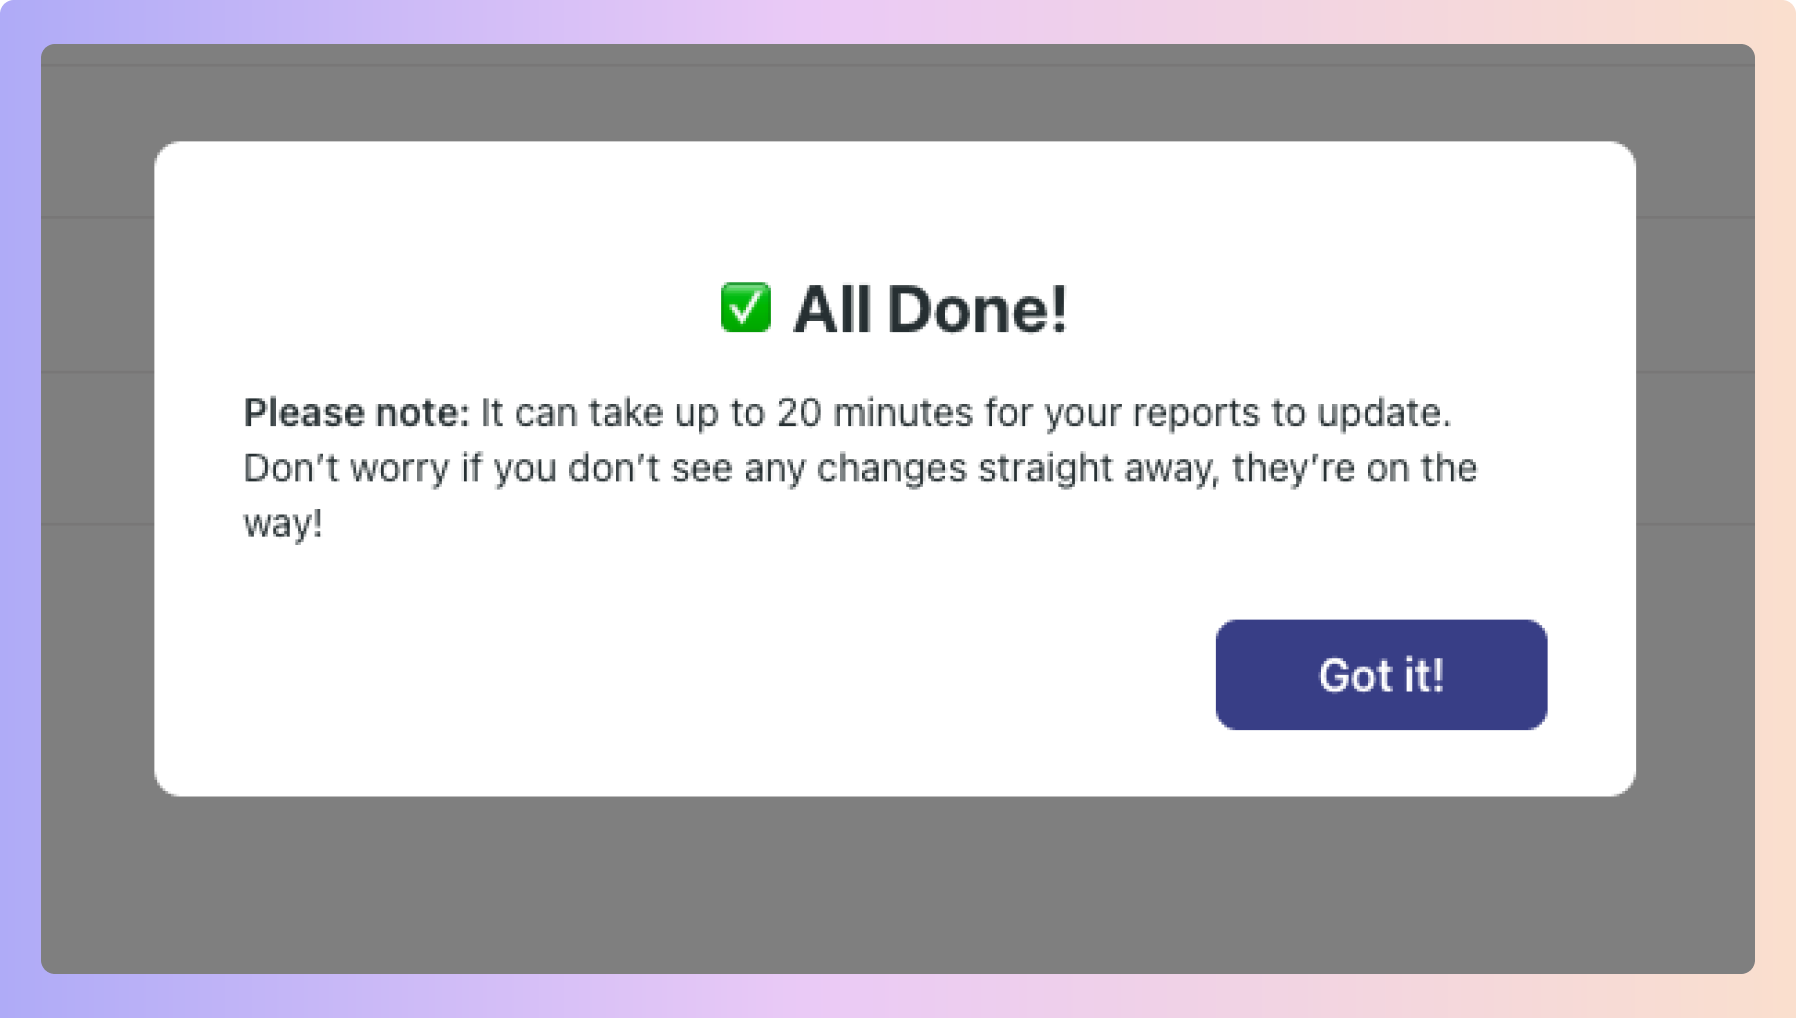
Once you change a Milestone link for any particular Stage you’ll see the below pop-up.
It can take up to 20 minutes for your reports to update with your new linked Milestone.

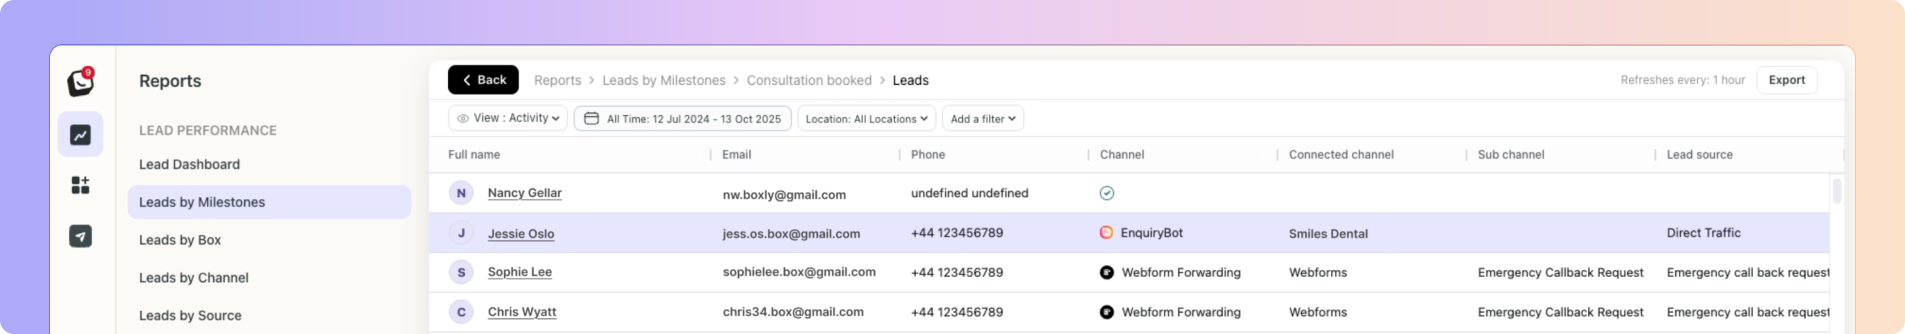
You can now click on any milestone bar to see exactly where those leads are at this moment.
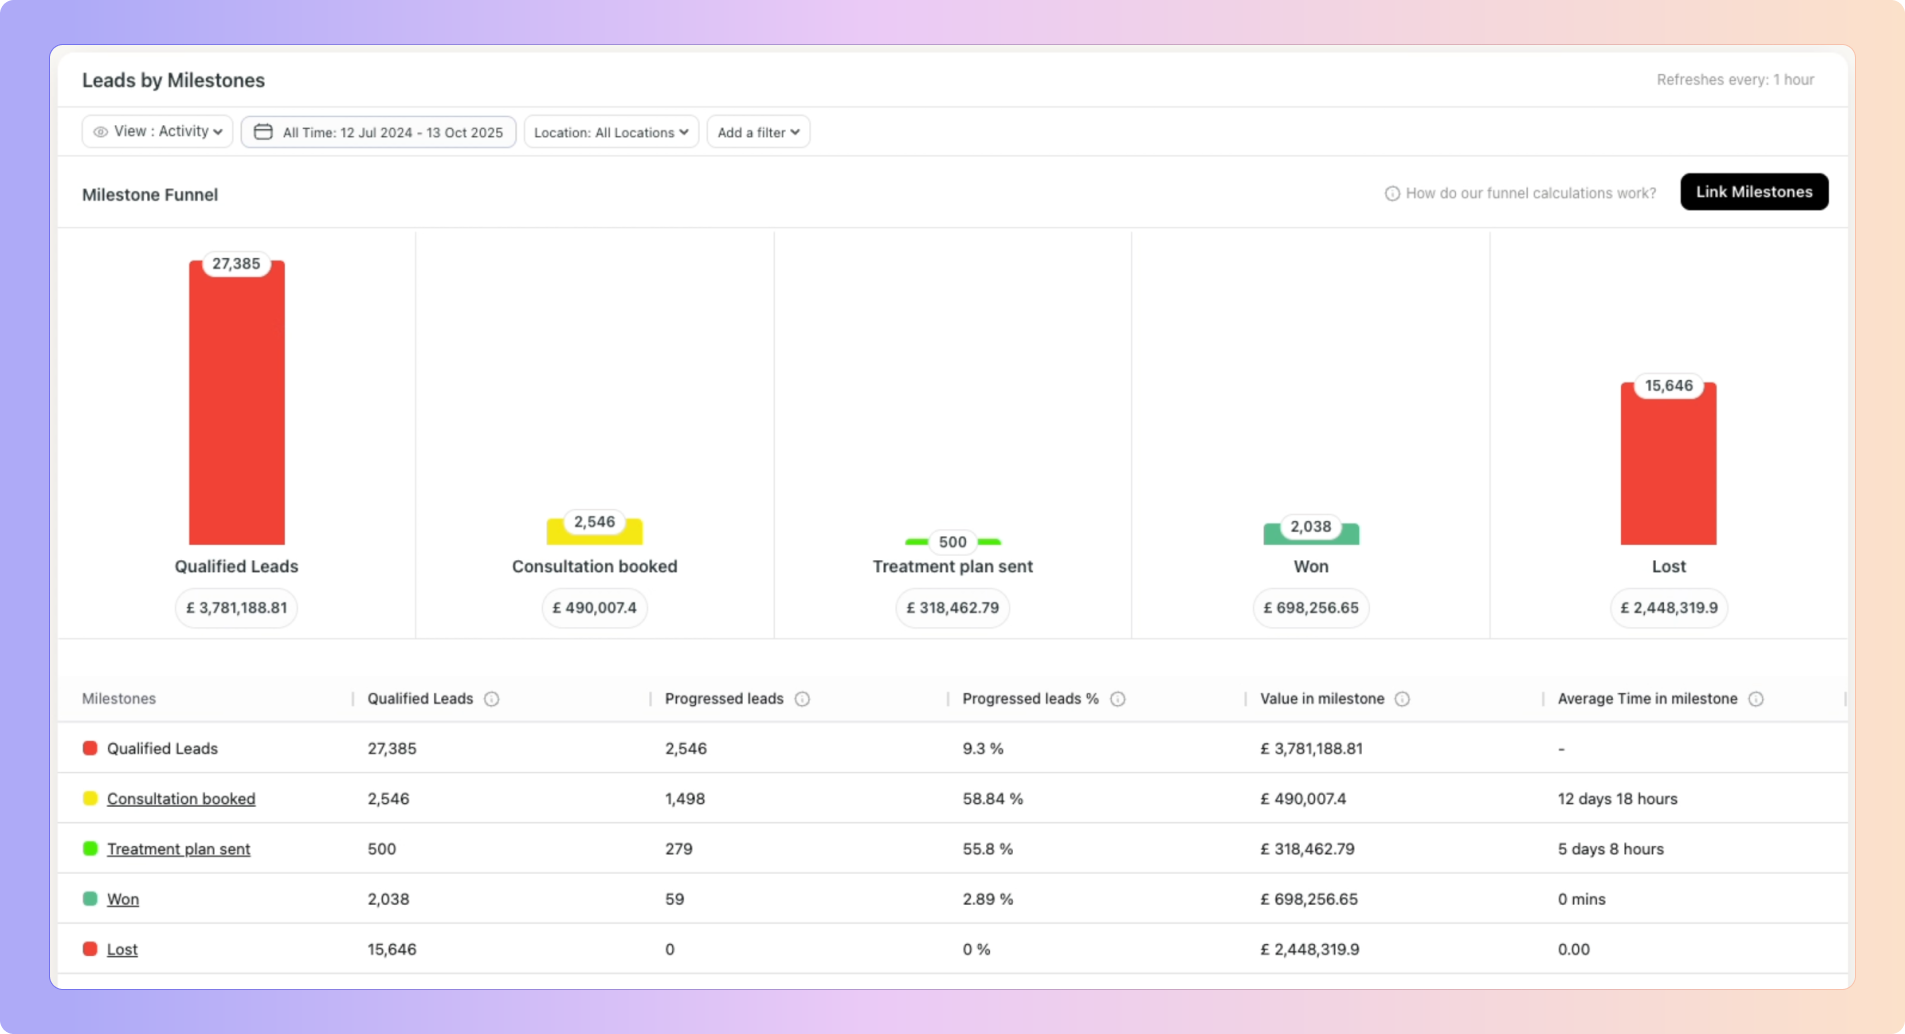
It will show the current box, current stage, and current assignee.
🧠 Example: If your Consultation Booked milestone shows 2,546 leads, you can now click on it and see where those 2,546 leads are today. Some may have moved to Treatment Plan Sent, some to Won, and some may still be in progress.
This clickable view is currently available only for the Milestone Report. It will come to Leads by Box in a future update.
Automatic Qualification
Leads previously classified as Other or Unknown, but later moved into a stage that’s linked to a milestone, will automatically be marked as Qualified by Boxly.
Accurate Ownership Tracking
All Milestones automatically records who was assigned to a lead as the lead moves through the milestone stages.
This ensures the correct team member always gets credit.
🧠 Example: If a lead is with Ava when it moves to Consultation Booked and later reassigned to Danny who moves it to Treatment Started, the report will show Ava for Consultation Booked and Danny for Treatment Started.
Dynamic Value Updates
When a lead enters a milestone, its current value is stored.
If the value is edited while the lead is still in that milestone, the figure automatically updates in the report.
Once the lead moves to a new milestone, that previous value becomes locked for accurate reporting for the previous milestone
End-to-End Visibility
Every milestone movement is captured with the date, value, and owner, giving you a complete, transparent history of how each lead progressed through your pipeline.
Boxly is here to help you work smarter, not harder, let’s keep streamlining your lead management together!
Contact us at [email protected] if you need any assistance!