✅ Click on the Reporting icon in your left toolbar
✅ In the dropdown list of reports you’ll see on the left, click into the Box Report to explore.
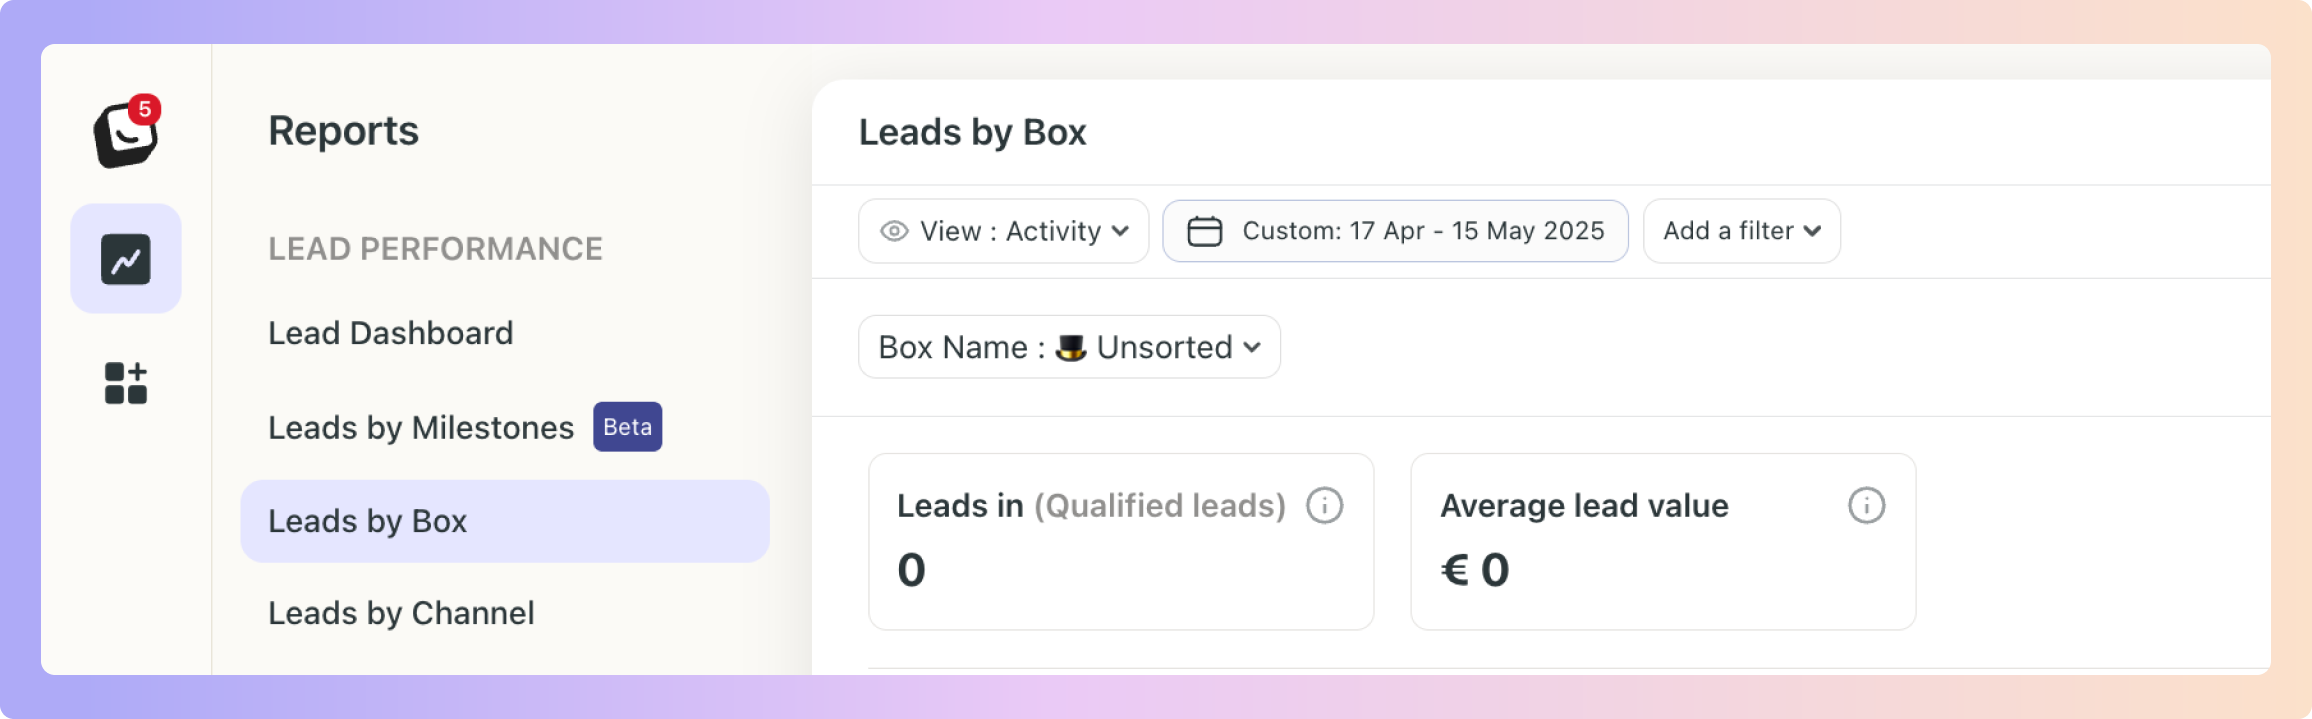
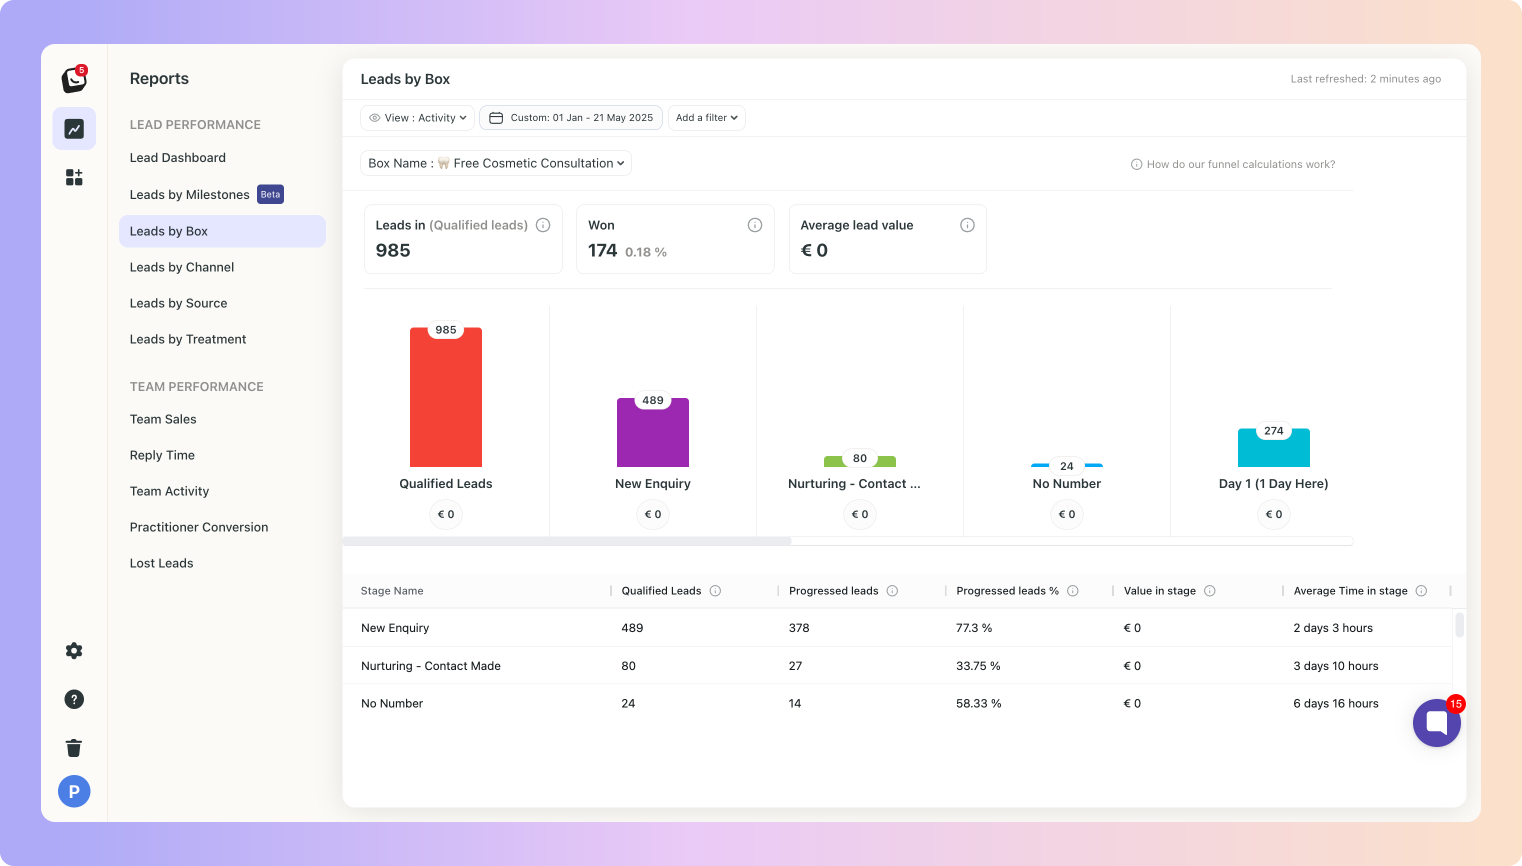
This report is similar to the Milestone Report but focuses on Boxes rather than milestones. It’s broken down by your workflow Stages.
Your lead by Box report shows all stages within each selected Box and includes the same list view details as the Milestone Report, but with the stage names specific to each selected Box.
✅ It also offers the same Activity and Cohort views for better tracking and analysis.
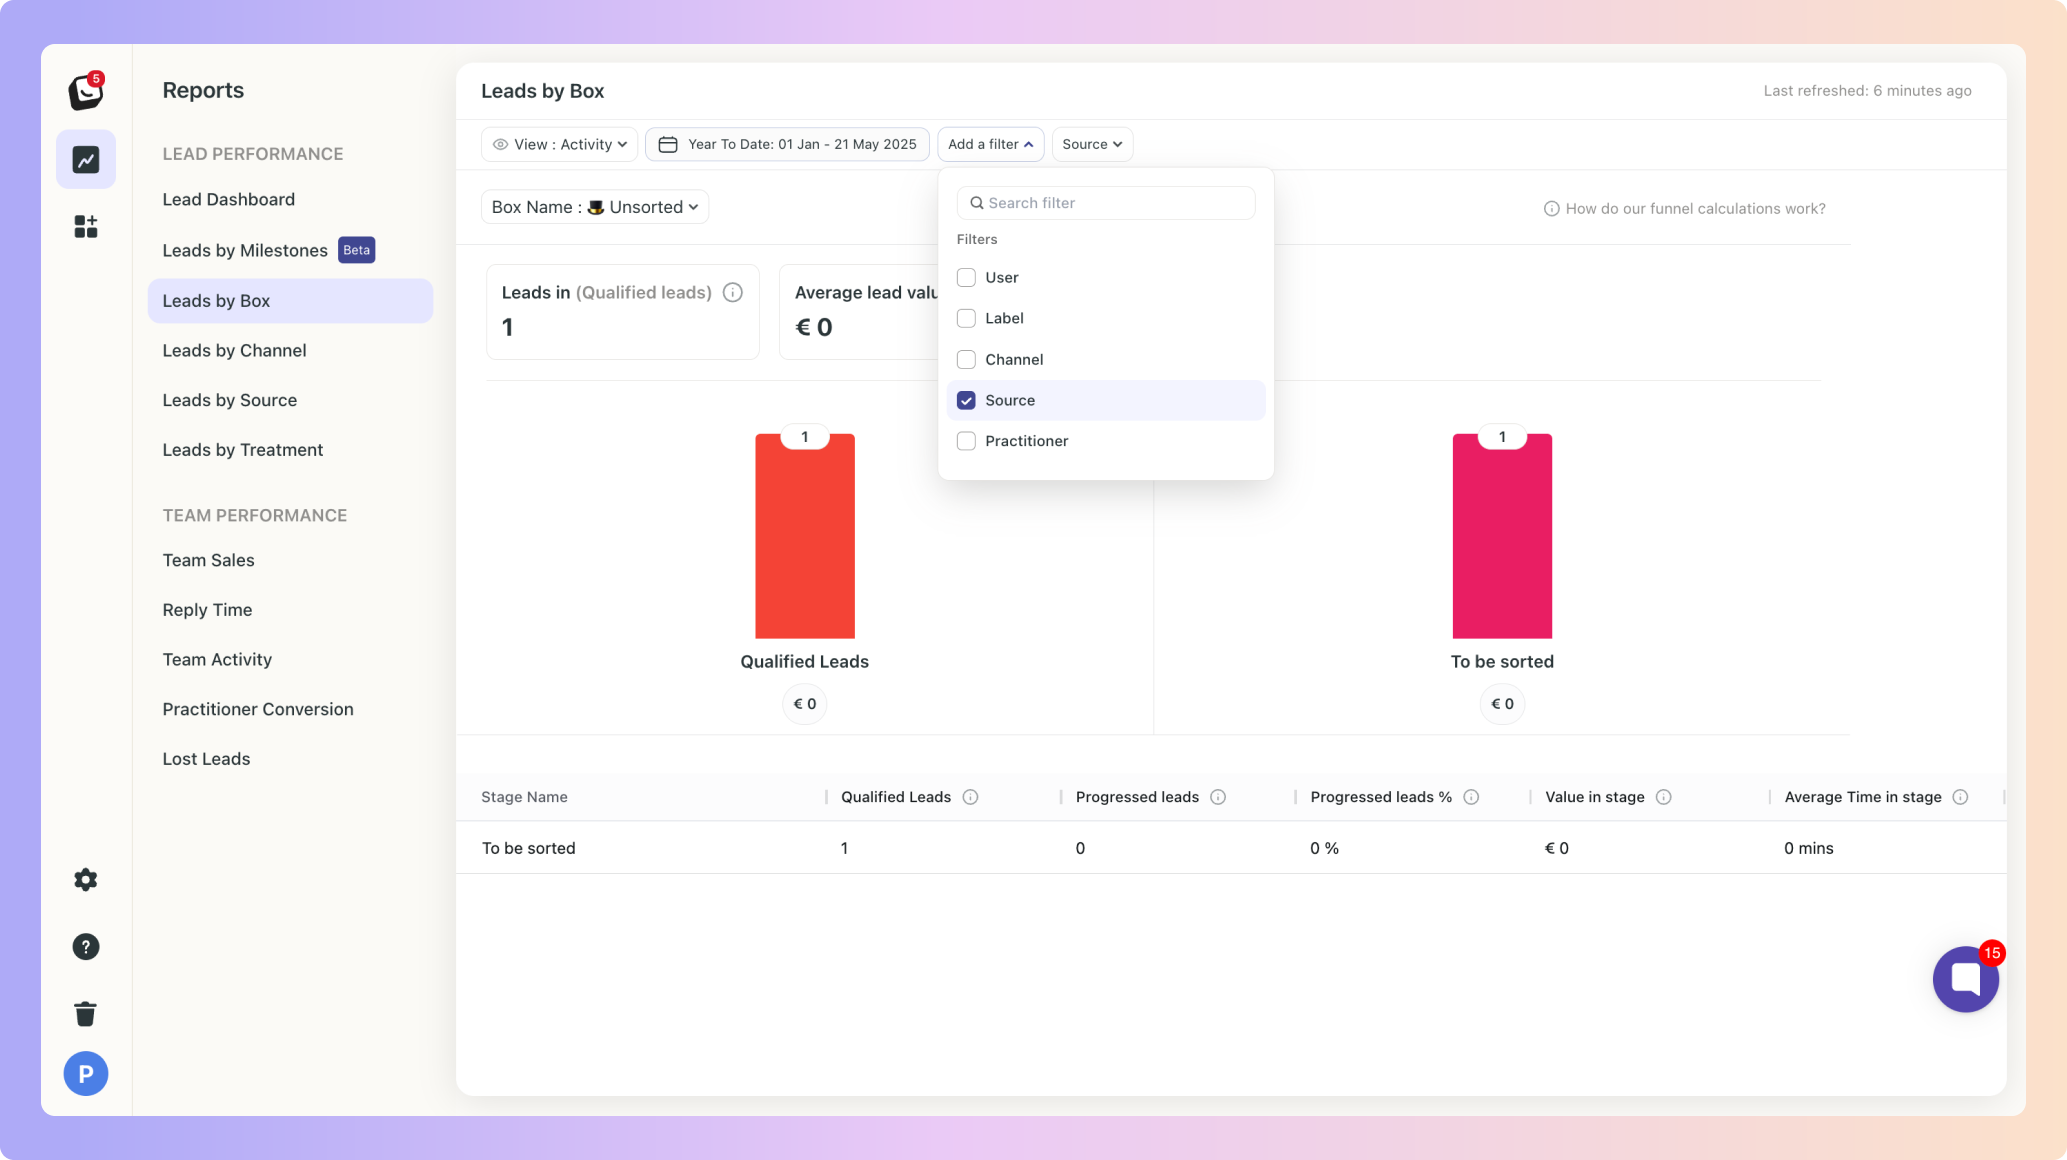
✅ Filters include: User, Channel, Label, and Lead source.
✅ Click on “Add Filter”
✅ Select the filter you want applied, like Sources
✅ The Filter’s options will appear next to “Add Filter”, select the specific filter within the category you chose. You can choose as many as you want.
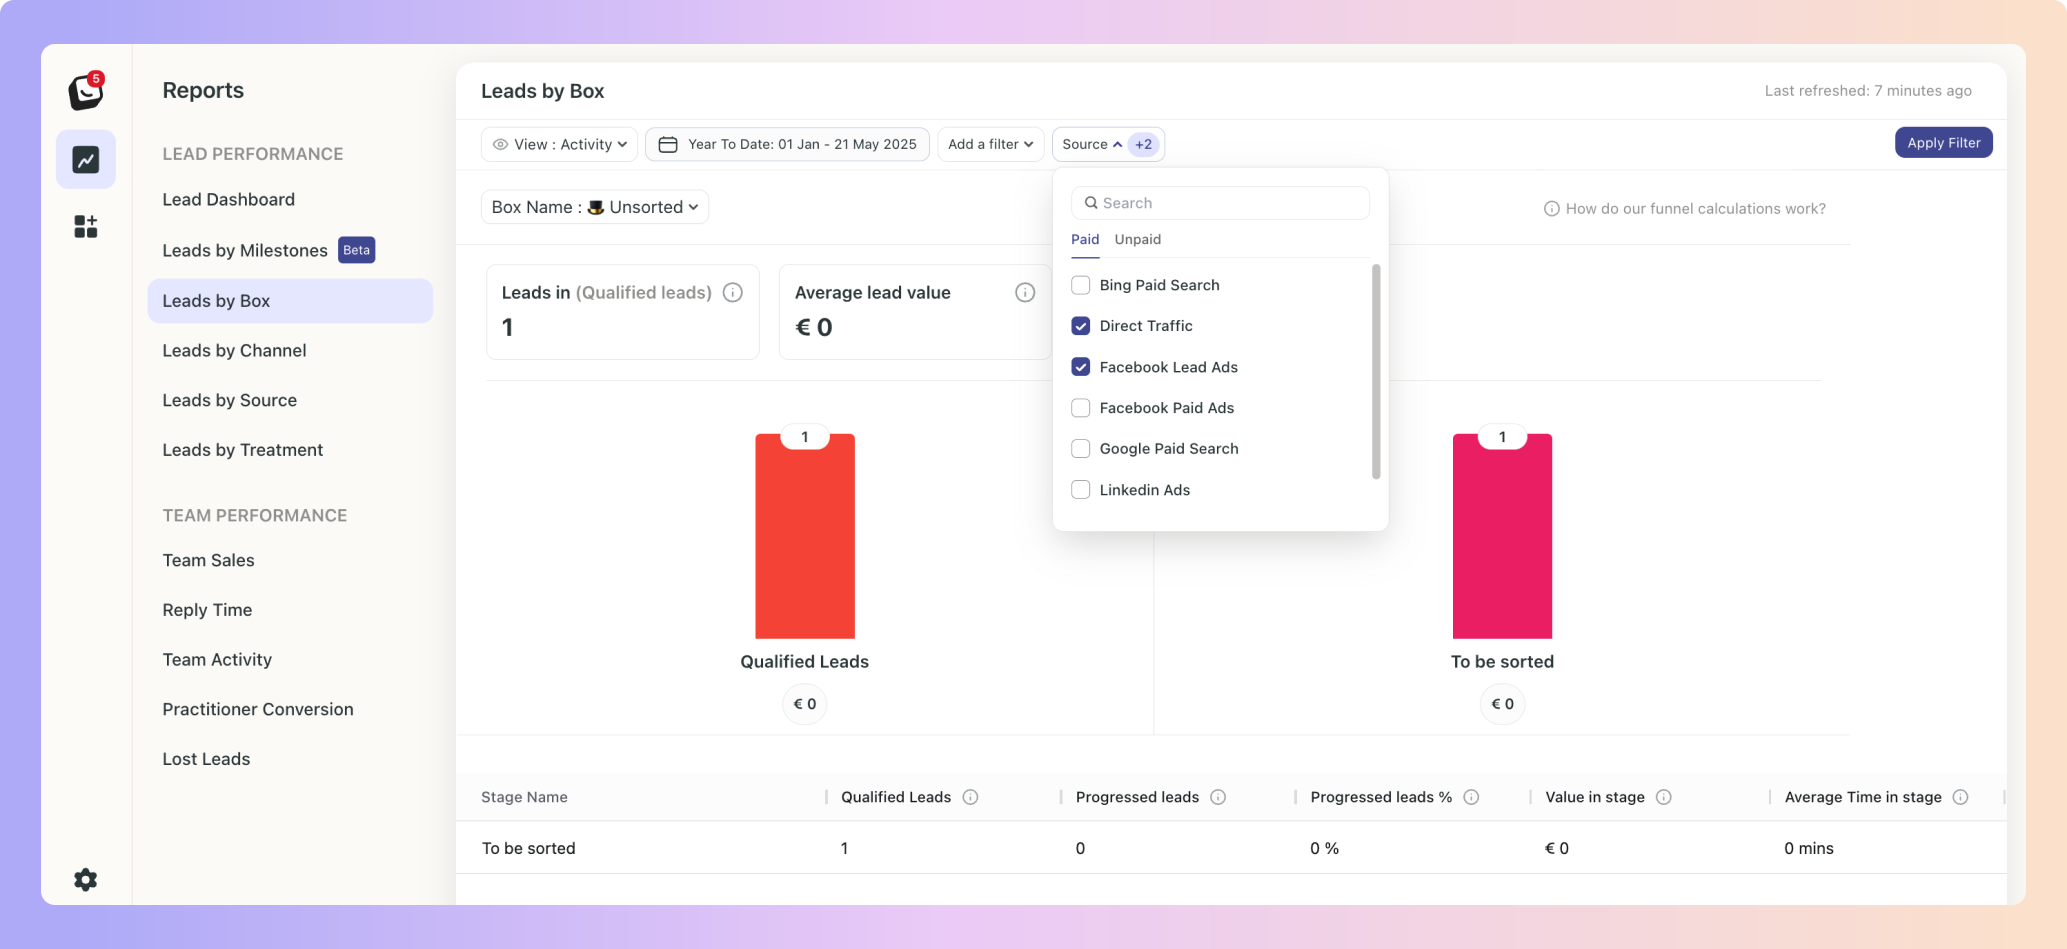
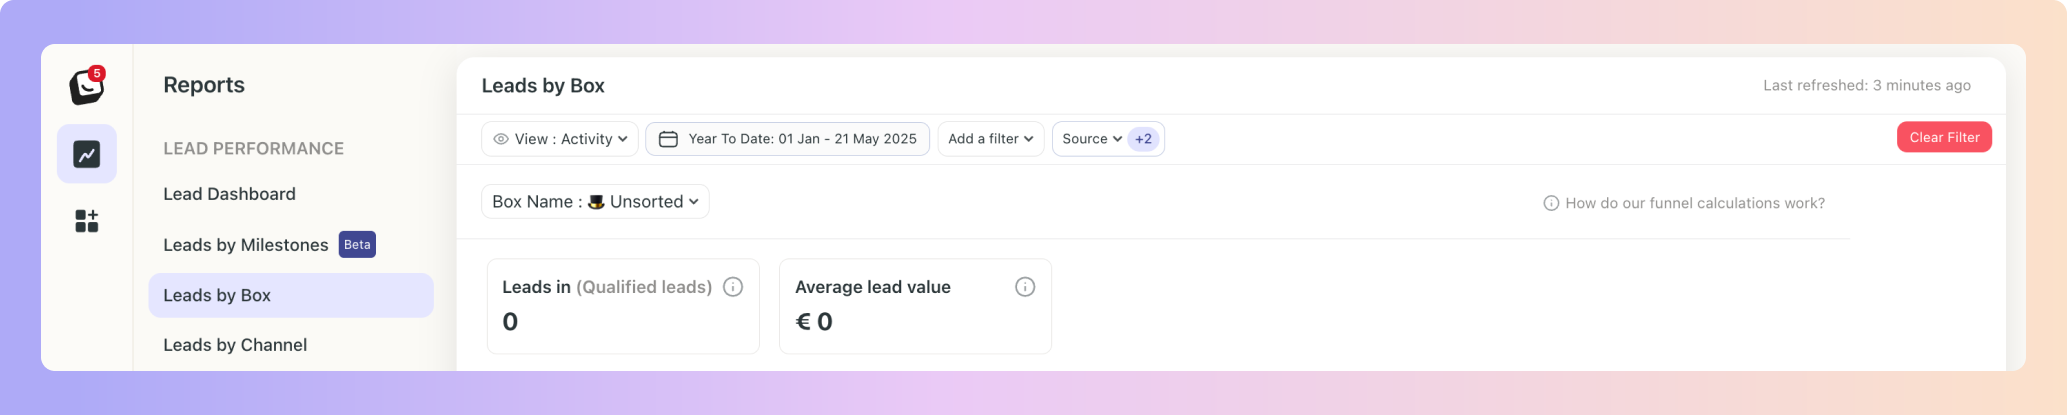
✅ Click “Apply Filter” button on the right and your filter will apply to your report, when you’re done simply click on the red “Clear Filter” button that appears once you’re in a filtered view.
✅ Click on “Date: Last 3 months”, the default time is Year To Date
✅ Select the date you want applied as follows:
1. Date range -
Options include: Today, Yesterday, Last 7 Days, Last 30 Days, Last 90 Days, Month To Date, Week To Date, Quarter To Date, Year To Date, Last Week, Last Month, Last 3 Months, Last 6 Months, and All Time
2. Starting - Choose a date
3. Ending - Choose a date
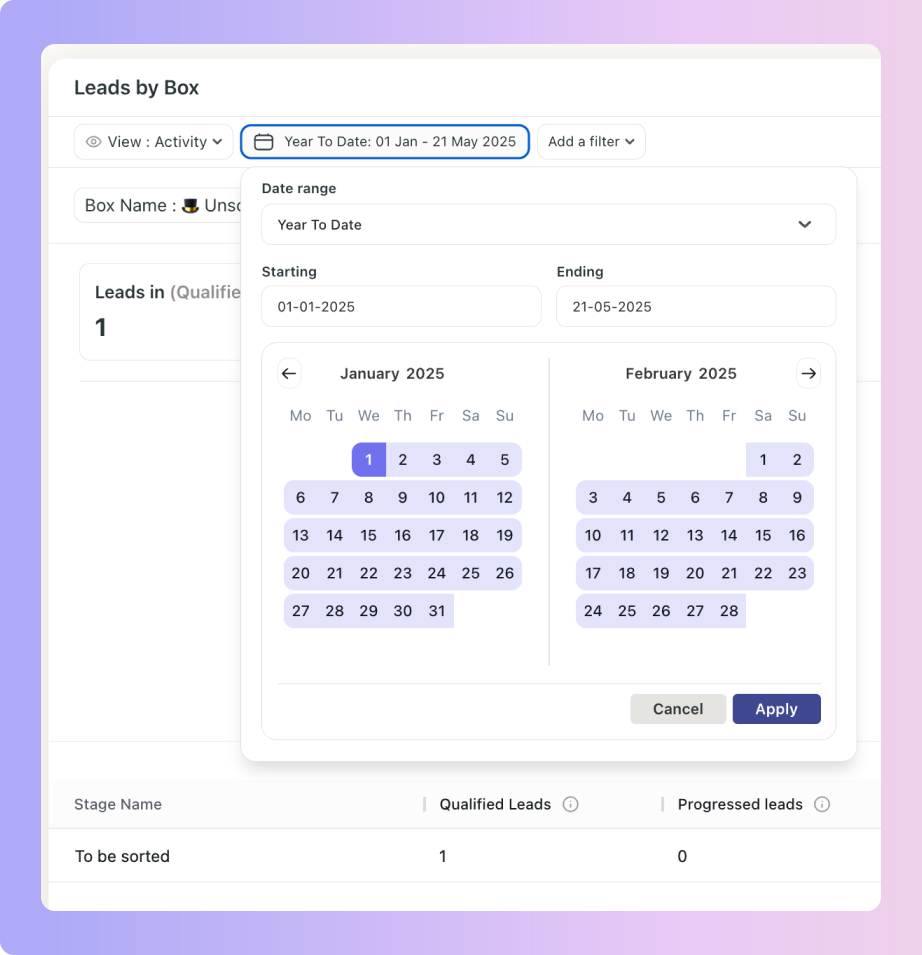
✅ Click the “Apply” button
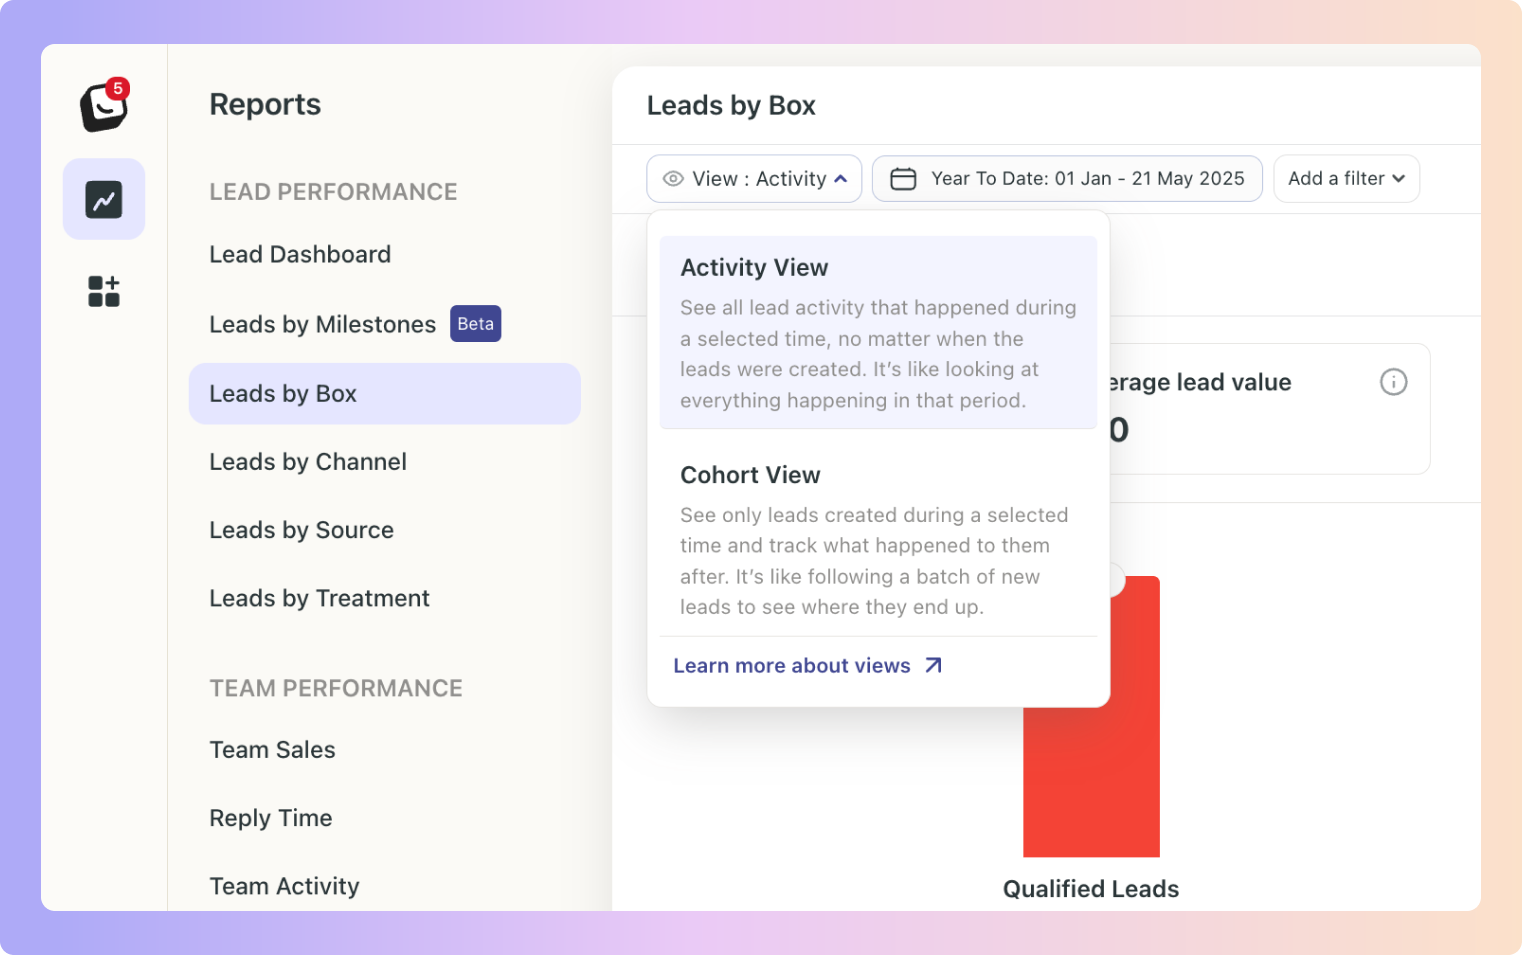
Activity View & Cohort View:
Activity View shows you what happened during a selected time period, like how leads moved, what actions were taken, and how many reached certain stages, regardless of when the leads were created.
Cohort View, on the other hand, focuses on leads that came in during a specific period and tracks where they ended up by a later date, helping you understand how long it takes for leads to convert and where they may be getting stuck in the process.
✅ Click on the “View” option at the top of your dashboard to toggle between the two views.
This view will show you what happened during the date range selected.
The data shown is based on the activity that took place for the leads, not based on the leads that came in during that time period.
In this view you can select a ‘starting’ date and a ‘where are we now’ date - a date range to see the number of leads generated during that period. Your ‘where are we now’ date will show where those leads are in terms of stages and milestones on your chosen date.
It doesn’t have to be the current date as the second one (‘where are we now’ date), this view will enable you to track how leads are doing in the process, how long it takes to become a sale and where your stop-gaps are.
For example, selecting January as the date range and February 28 as the "where are they" date will show where leads generated in January are in terms of stages as of February 28.
If leads skip stages, those skipped won’t count in that stage’s numbers.
Example: Imagine a 5-stage sales flow:
Stages: Lead → Qualified → Consultation Booked → Treatment started → Won✅ If Customer A moves from "Lead" directly to "Consultation Booked" - skipping the "Qualified" stage, then Customer A won't be counted in any metrics for the "Qualified" stage.
✅ This means your "Qualified" stage conversion rate only reflects leads that actually went through that stage.
✅ If you had 100 leads, and 20 of them skipped the "Qualified" stage, your qualified-to-Consultation Booked conversion rate would only be calculated based on the 80 leads that actually went through qualification
When a lead moves backward, it cancels the previous forward step, which means there will be no double-counting - Any previous metrics will be "undone" and excluded from calculations
Example: Imagine a 5-stage sales flow:
Stages: Lead → Qualified → Consultation Booked → Treatment started → Won✅ Customer B progresses from "Consultation Booked" to "Treatment started"
✅ Later, they move back to "Consultation Booked" for additional information.
✅ When calculating how many leads moved from "Consultation Booked" to "Treatment started," Customer B is only counted once
Their backward movement essentially cancels out their previous forward movement for calculation purposes
We did this so that your reports would be as accurate as possible, leads won’t be counted multiple times if they move back and forth between stages.
Direct Progression Only: Progress rates are based on leads that go from one stage to the next without skipping.
Example: Imagine a 5-stage sales flow:
Stages: Lead → Qualified → Consultation Booked → Treatment started → Won✅ You have 100 leads in the "Qualified" stage
✅ 60 move to "Consultation Booked" (the next stage)
✅ 10 skip ahead to "Treatment started" and 5 skip all the way to "Won"
Your stage progression percentage from "Qualified" to "Consultation Booked" would be 60% (only counting the 60 that followed the direct path)
The 15 leads that skipped ahead aren't included in this specific progression calculation.
We did this to help you understand how effective your current stages are.
This report measures how long leads typically spend in each stage before advancing.
It only includes leads that moved forward, leads that are stuck are excluded to keep averages accurate.
Example: Imagine a 5-stage sales flow:
Stages: Lead → Qualified → Consultation Booked → Treatment started → Won✅ You're analysing January's data
✅ 50 leads were in the "Consultation Booked" stage at some point during January
✅ 40 of them advanced to later stages within January
They (the 40) spent an average of 6 days in the "Consultation Booked" stage✅ 10 remained in "Consultation Booked" from January 1st through January 31st
These 10 are excluded from the calculation✅ Your reported "Avg Time in Consultation Booked Stage" would be 6 days
This gives you a more accurate picture of active movement through your Stages by excluding stagnant leads that would otherwise skew your reports.

Boxly is here to help you work smarter, not harder, let’s keep streamlining your lead management together!
Contact us at [email protected] if you need any assistance!