✅ Click on the Reporting icon in your left toolbar
✅ In the dropdown list of reports you’ll see on the left, click into the Source Report to explore.
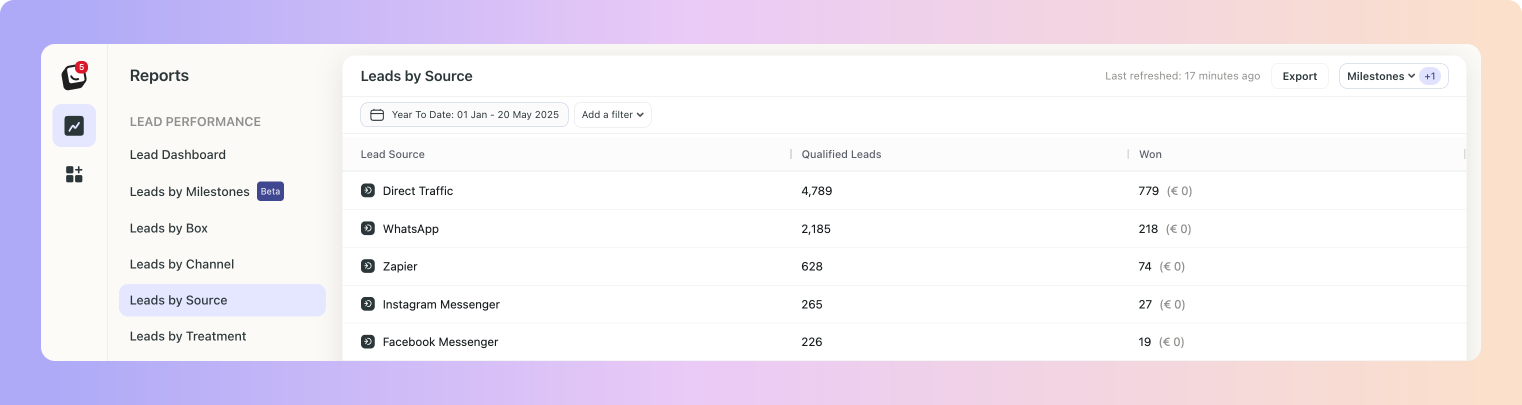
We built the Lead Source Report to show you which of your sources bring in the most leads, this way you know where to focus your marketing efforts towards.
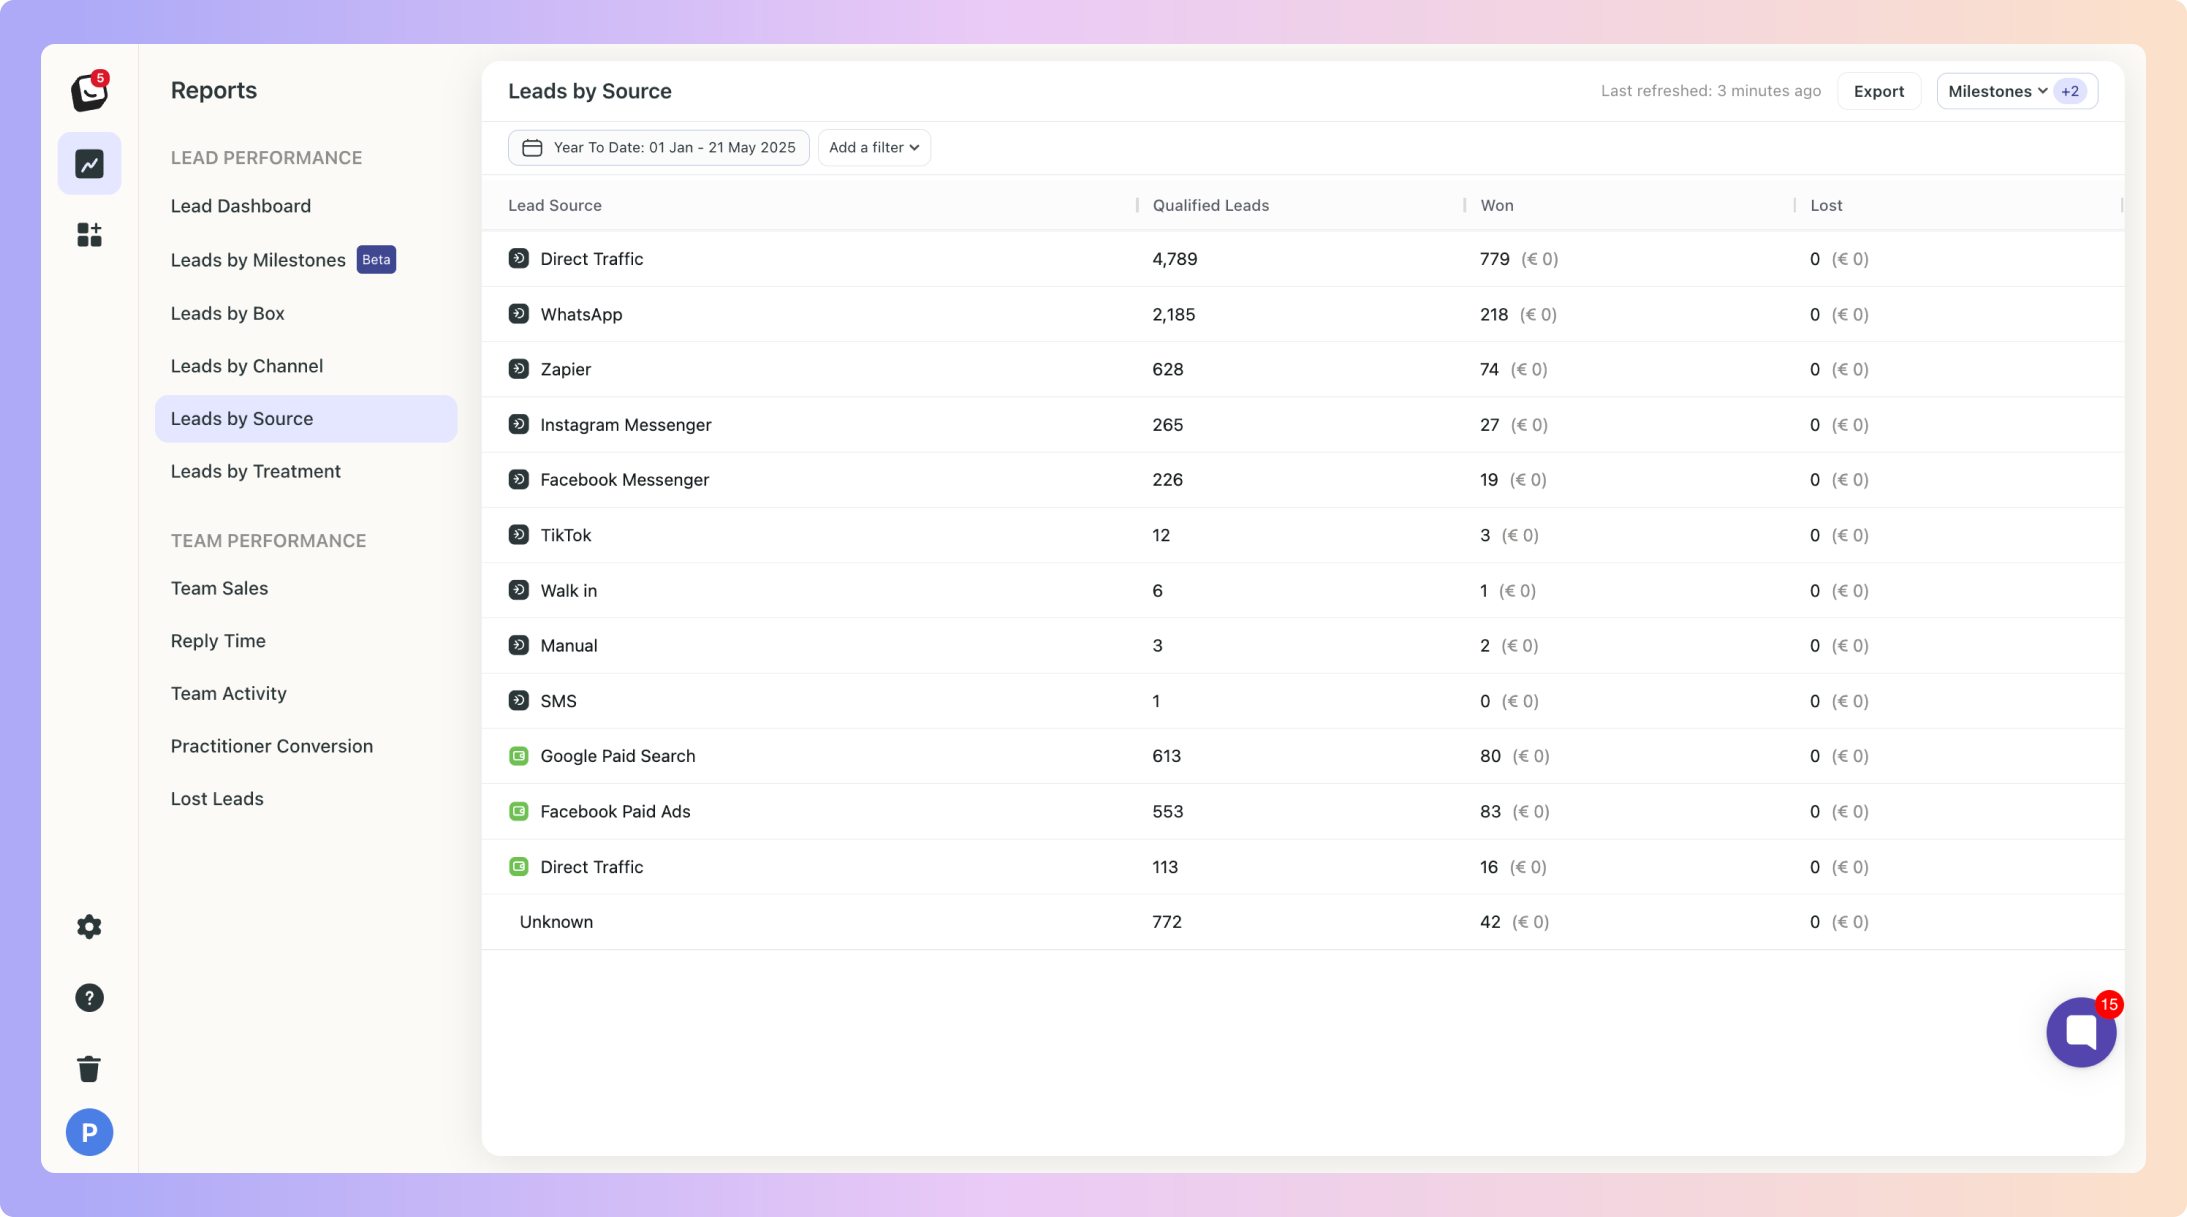
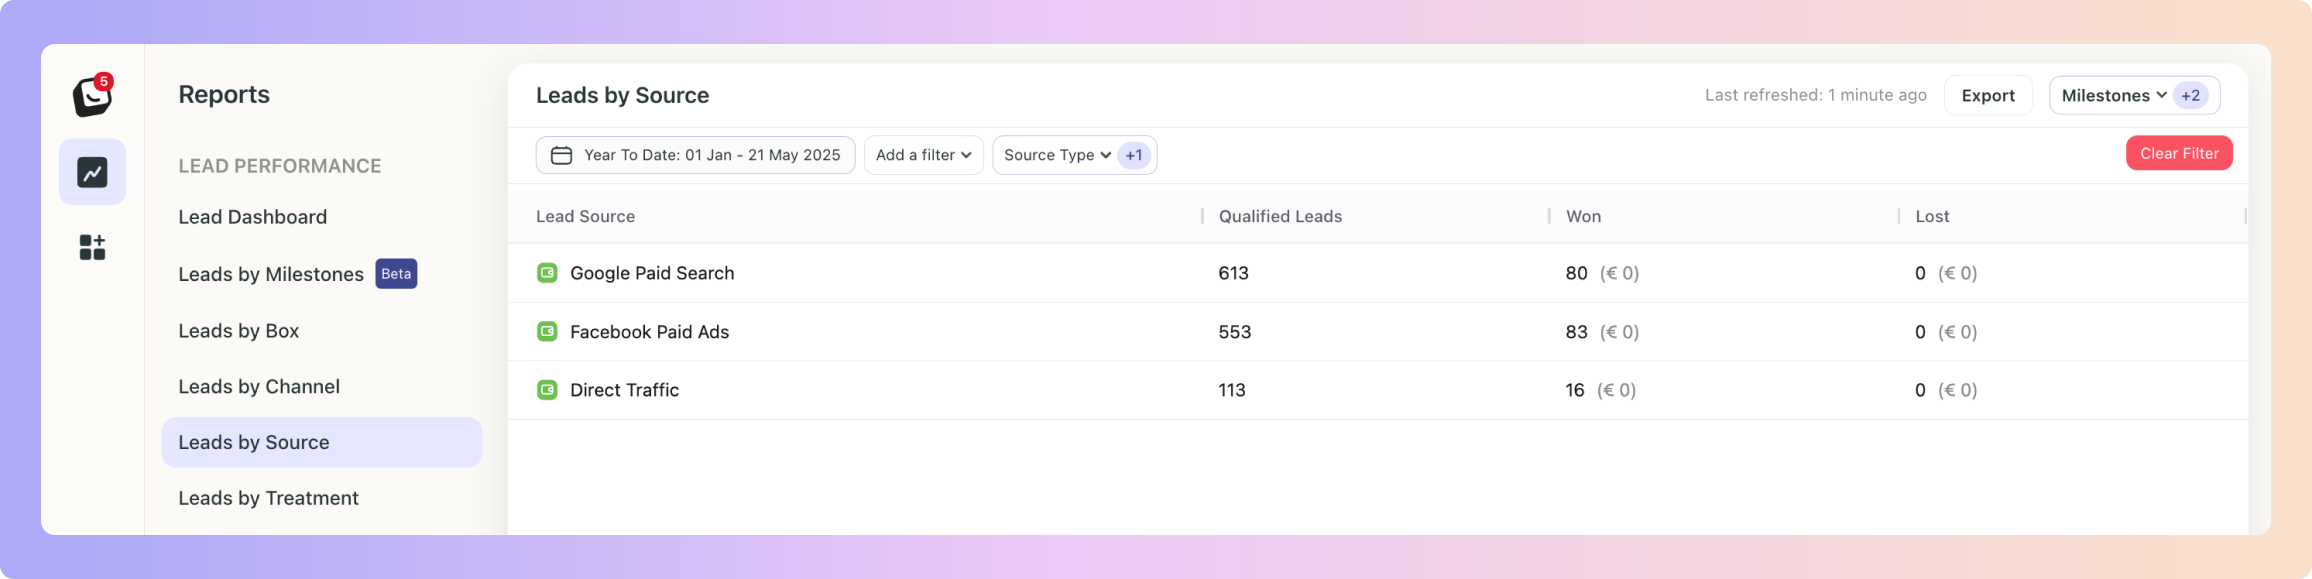
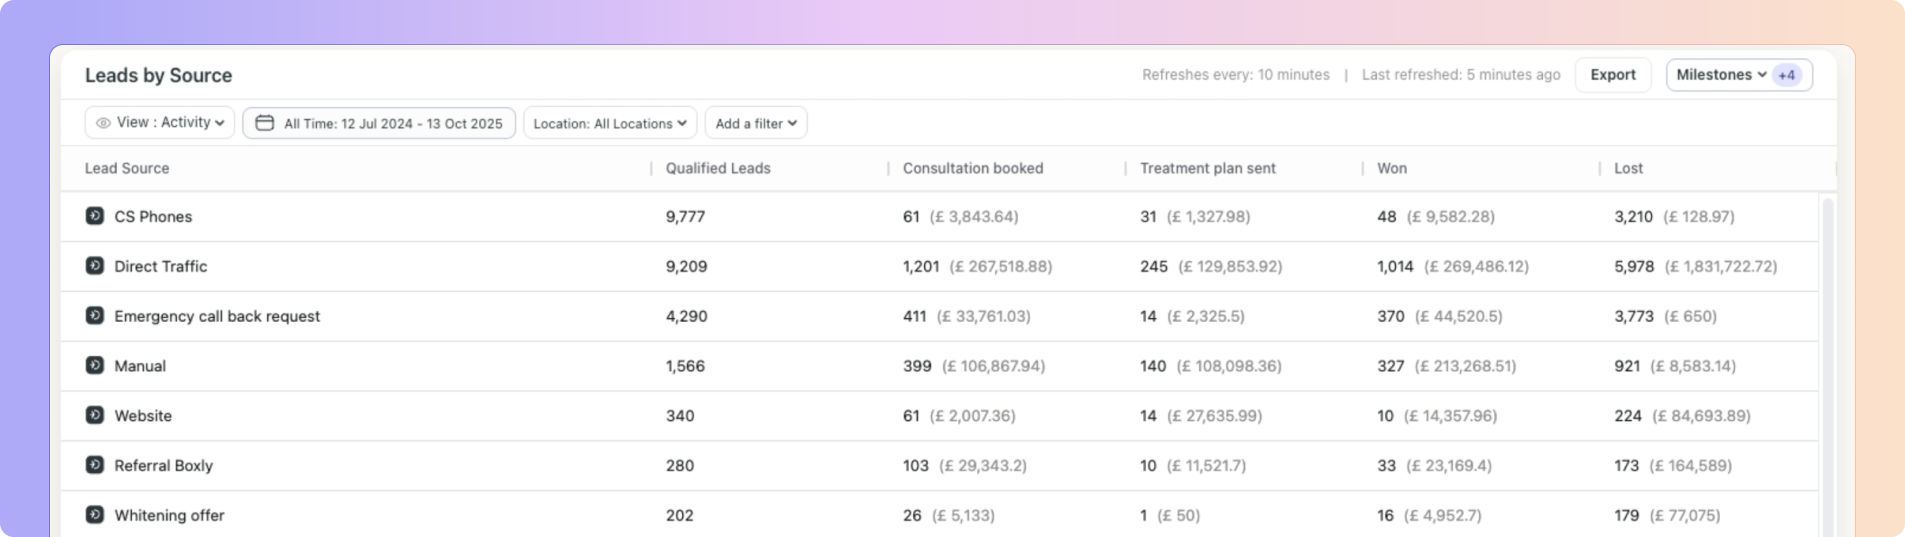
All lead sources will be displayed in a list format, with the highest sources first. By default, this report will show "Qualified Leads", which are the number of qualified leads received from each source.
What are Qualified Leads?
All leads left after removing Spam leads and “Other”, and Binned from Incoming.
Head over to Boxly's AI Assist: Classifying Leads article, for the pull run down on Qualified Leads: Boxly's AI Assist: Classifying Leads
✅ Click on a lead source to show you the actual leads in a list format.
✅ Available filters include: User, Channel, Label, Box, and Source type (Paid and Unpaid).
Milestones are a flexible way to track all the meaningful moments that happen in your pipeline, they are the key checkpoints in your sales journey that help you measure lead progression.
They’re tied to your Boxly Stages, so as leads move through your pipeline, Boxly automatically tracks when they pass each milestone.
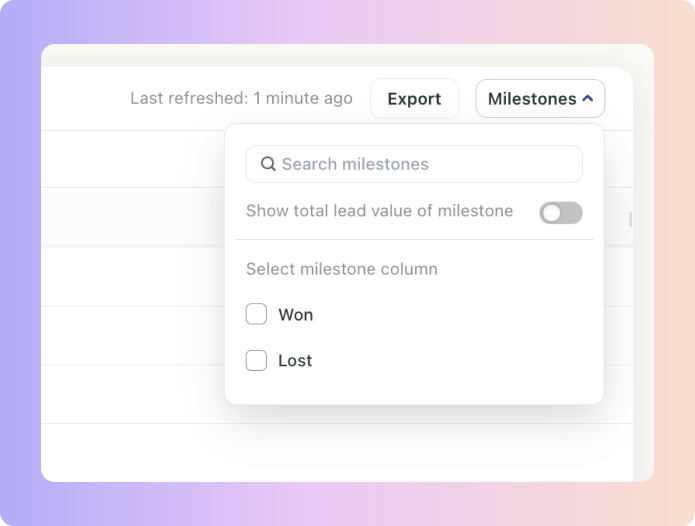
If you want to add the values of the milestones as columns to your view, simply click on the top “Milestones” button and select the milestone you want to display.
✅ Click on “Add Filter”
✅ Select the filter you want applied, like Source type & Channel
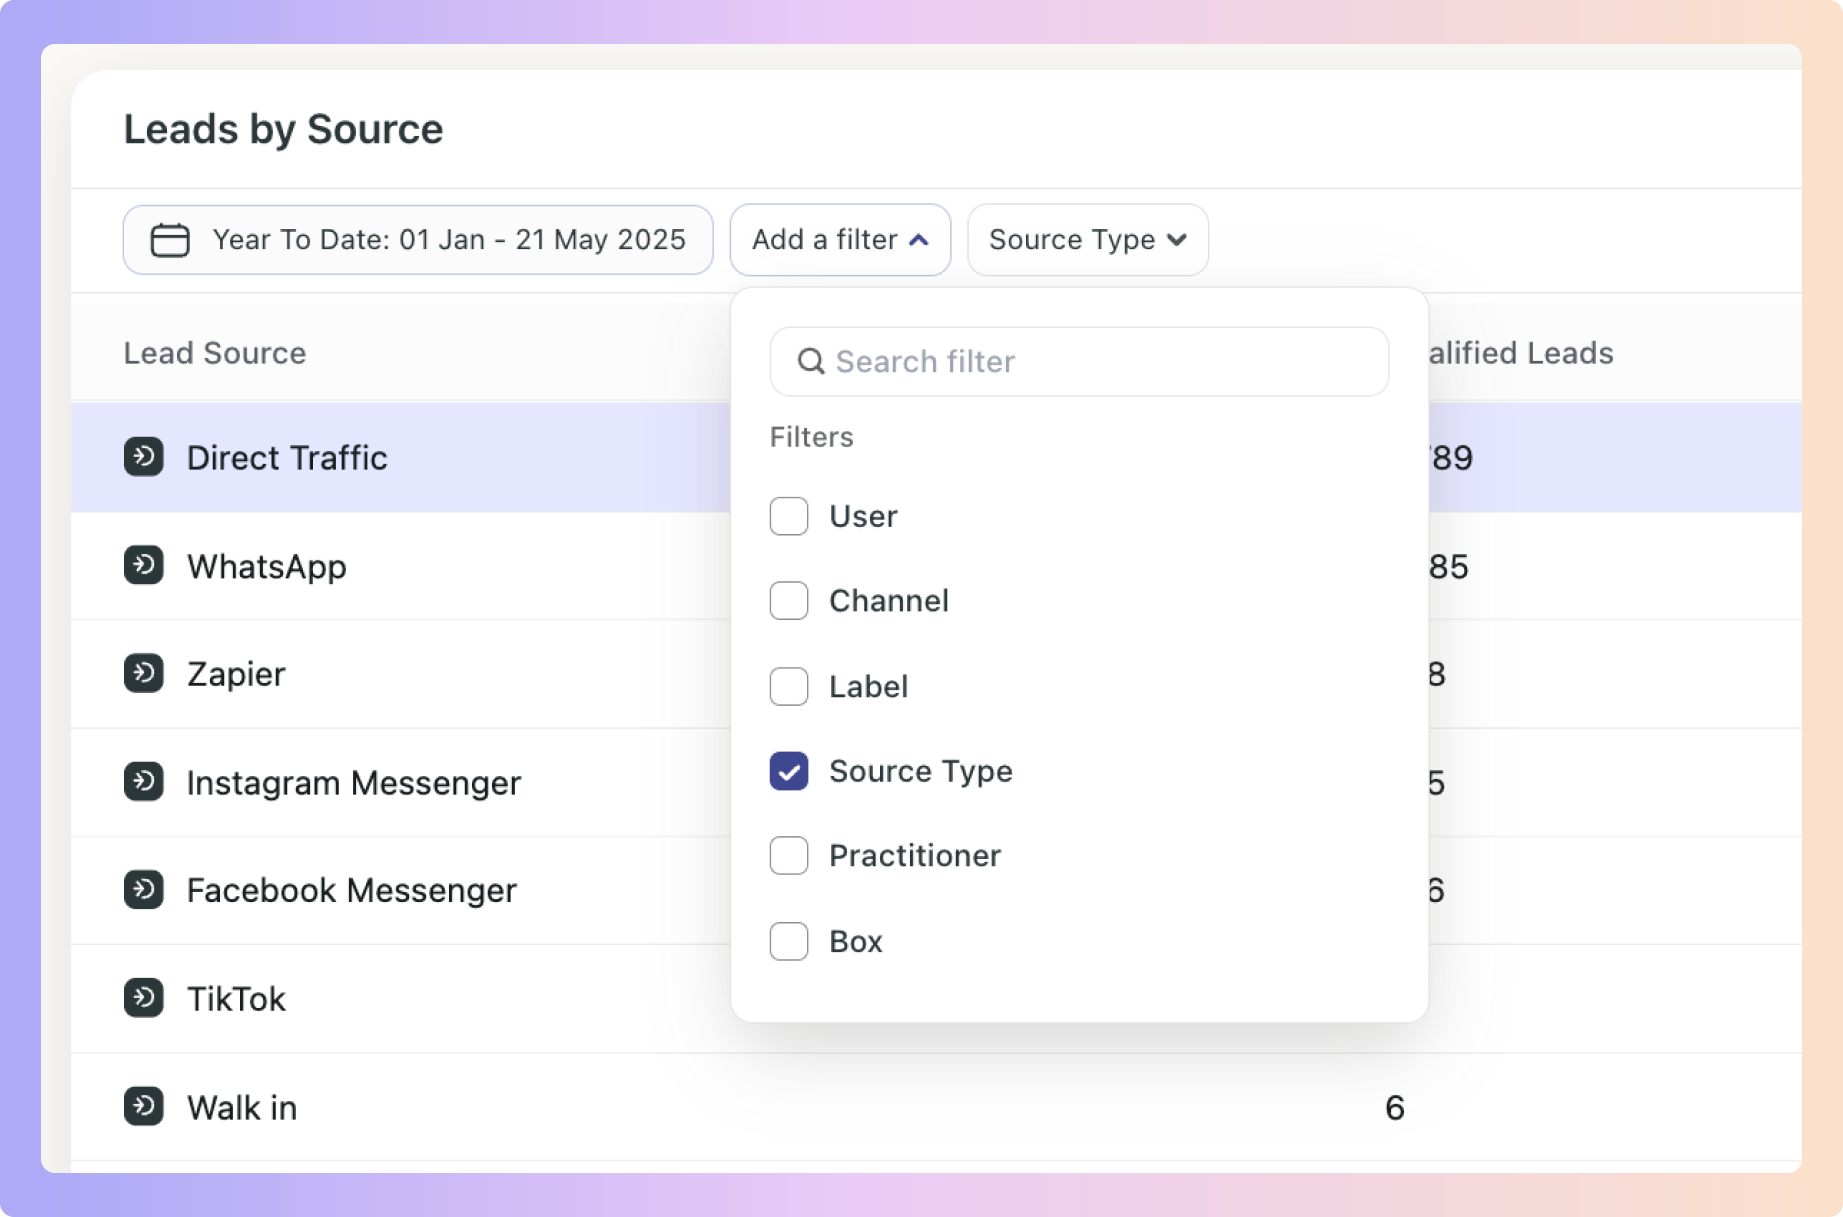
✅ The Filter’s options will appear next to “Add Filter”, select the specific filter within the category you chose. You can choose as many as you want.
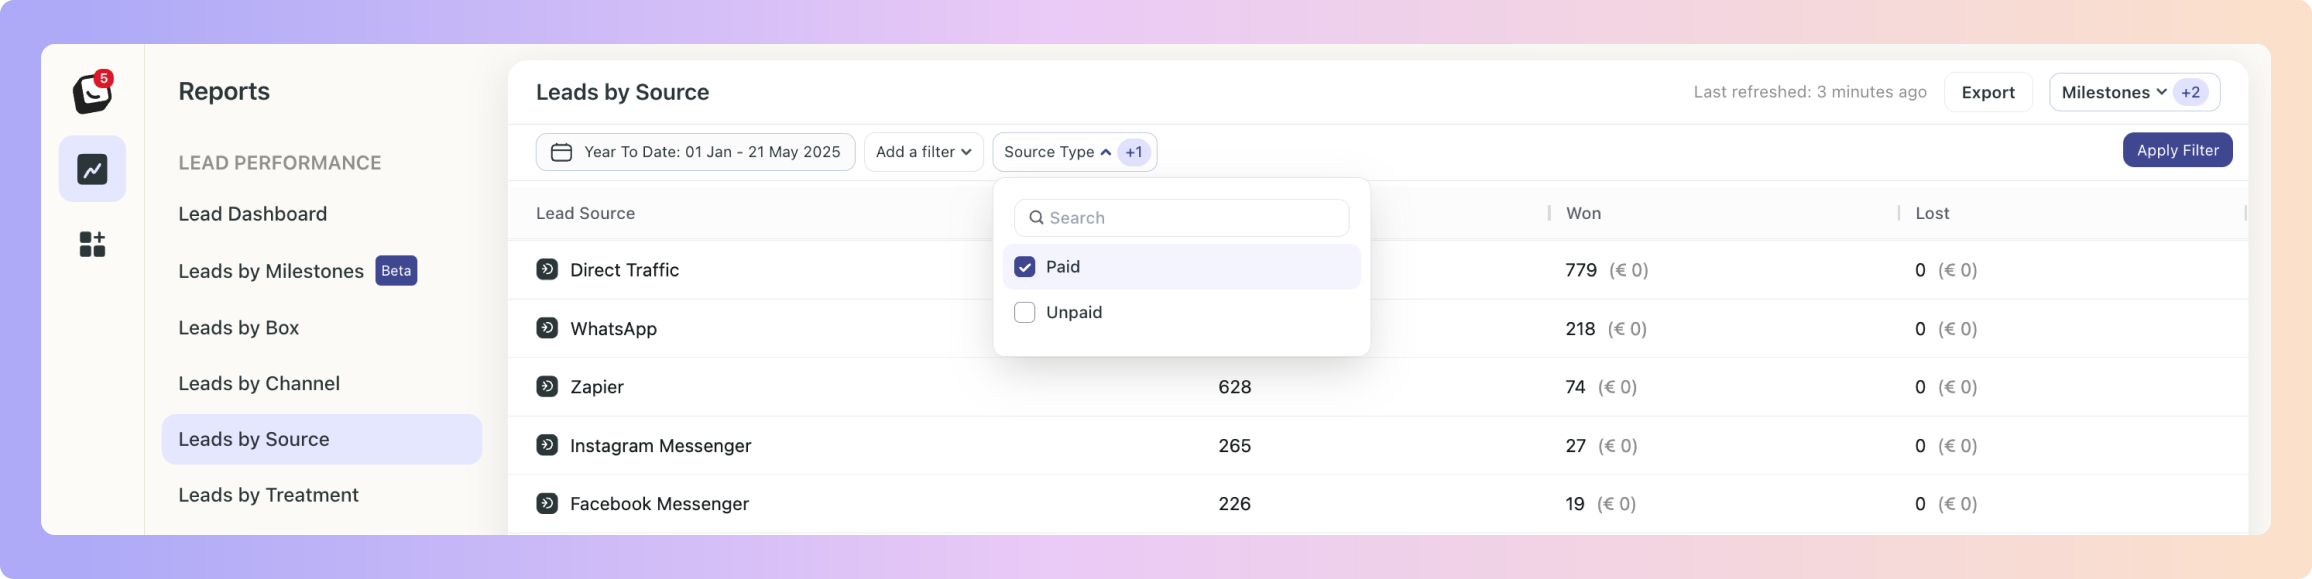
✅ Click “Apply Filter” button on the right and your filter will apply to your report, when you’re done simply click on the red “Clear Filter” button that appears once you’re in a filtered view.
Location Filter: Only applicable if you’re on the Multi-Location Plan
You can also filter your Lead Sources by your locations.
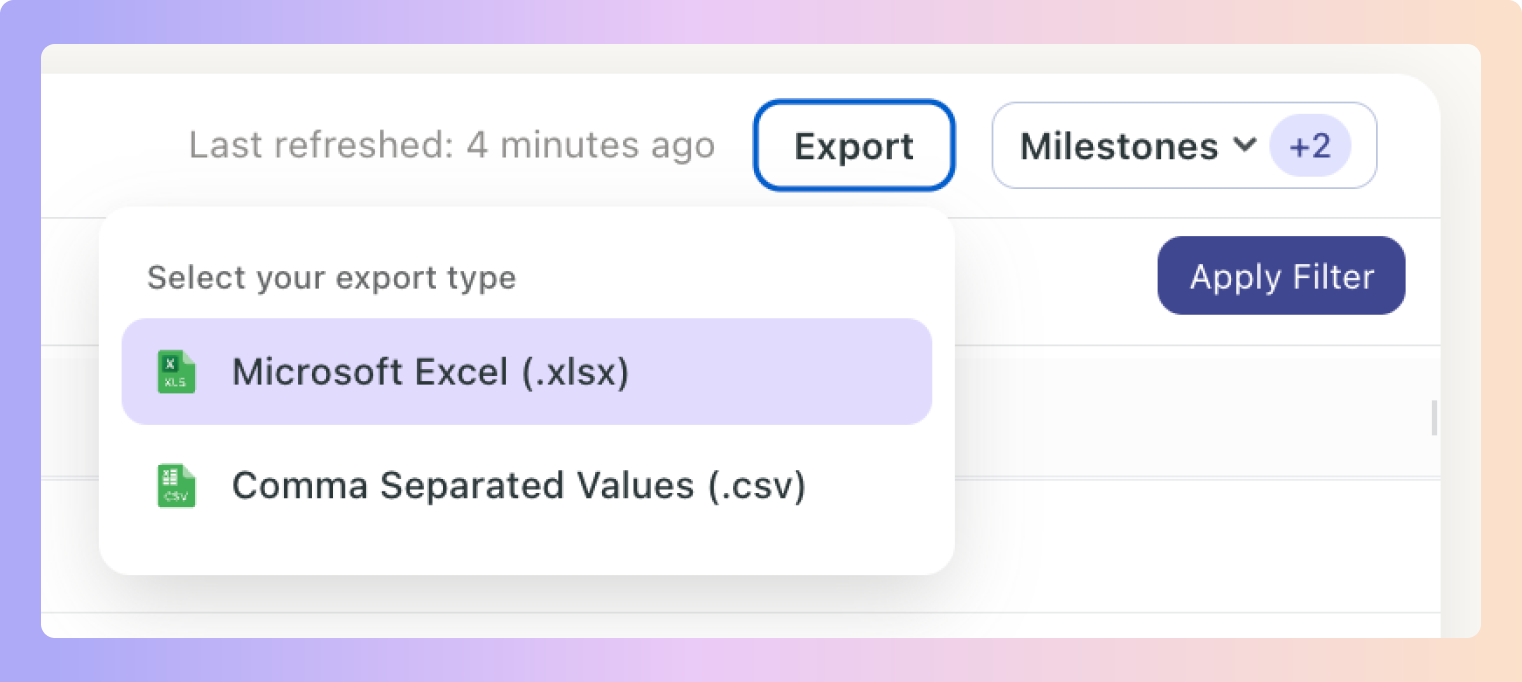
✅ Click on the top “Export” button to export your report.
If any filters are active, your exported report will only reflect the data you’ve chosen.
In the example below your Source Report will be filtered by the Milestone you’ve chosen.
You can export into .csv & .xlsx formats

Previously, reports only had Cohort View, which showed data for leads created within the selected time period.
🧠 Example:
If a lead came in last month but booked a consultation this week, Activity View will now include it.
You can click the numbers such as “61 consultations booked” to see who those leads are, their current box, and stage.
Boxly is here to help you work smarter, not harder, let’s keep streamlining your lead management together!
Contact us at [email protected] if you need any assistance!