✅ Click on the Reporting icon in your left toolbar
✅ In the dropdown list of reports you’ll see on the left, click into the Team Sales Reports to explore.
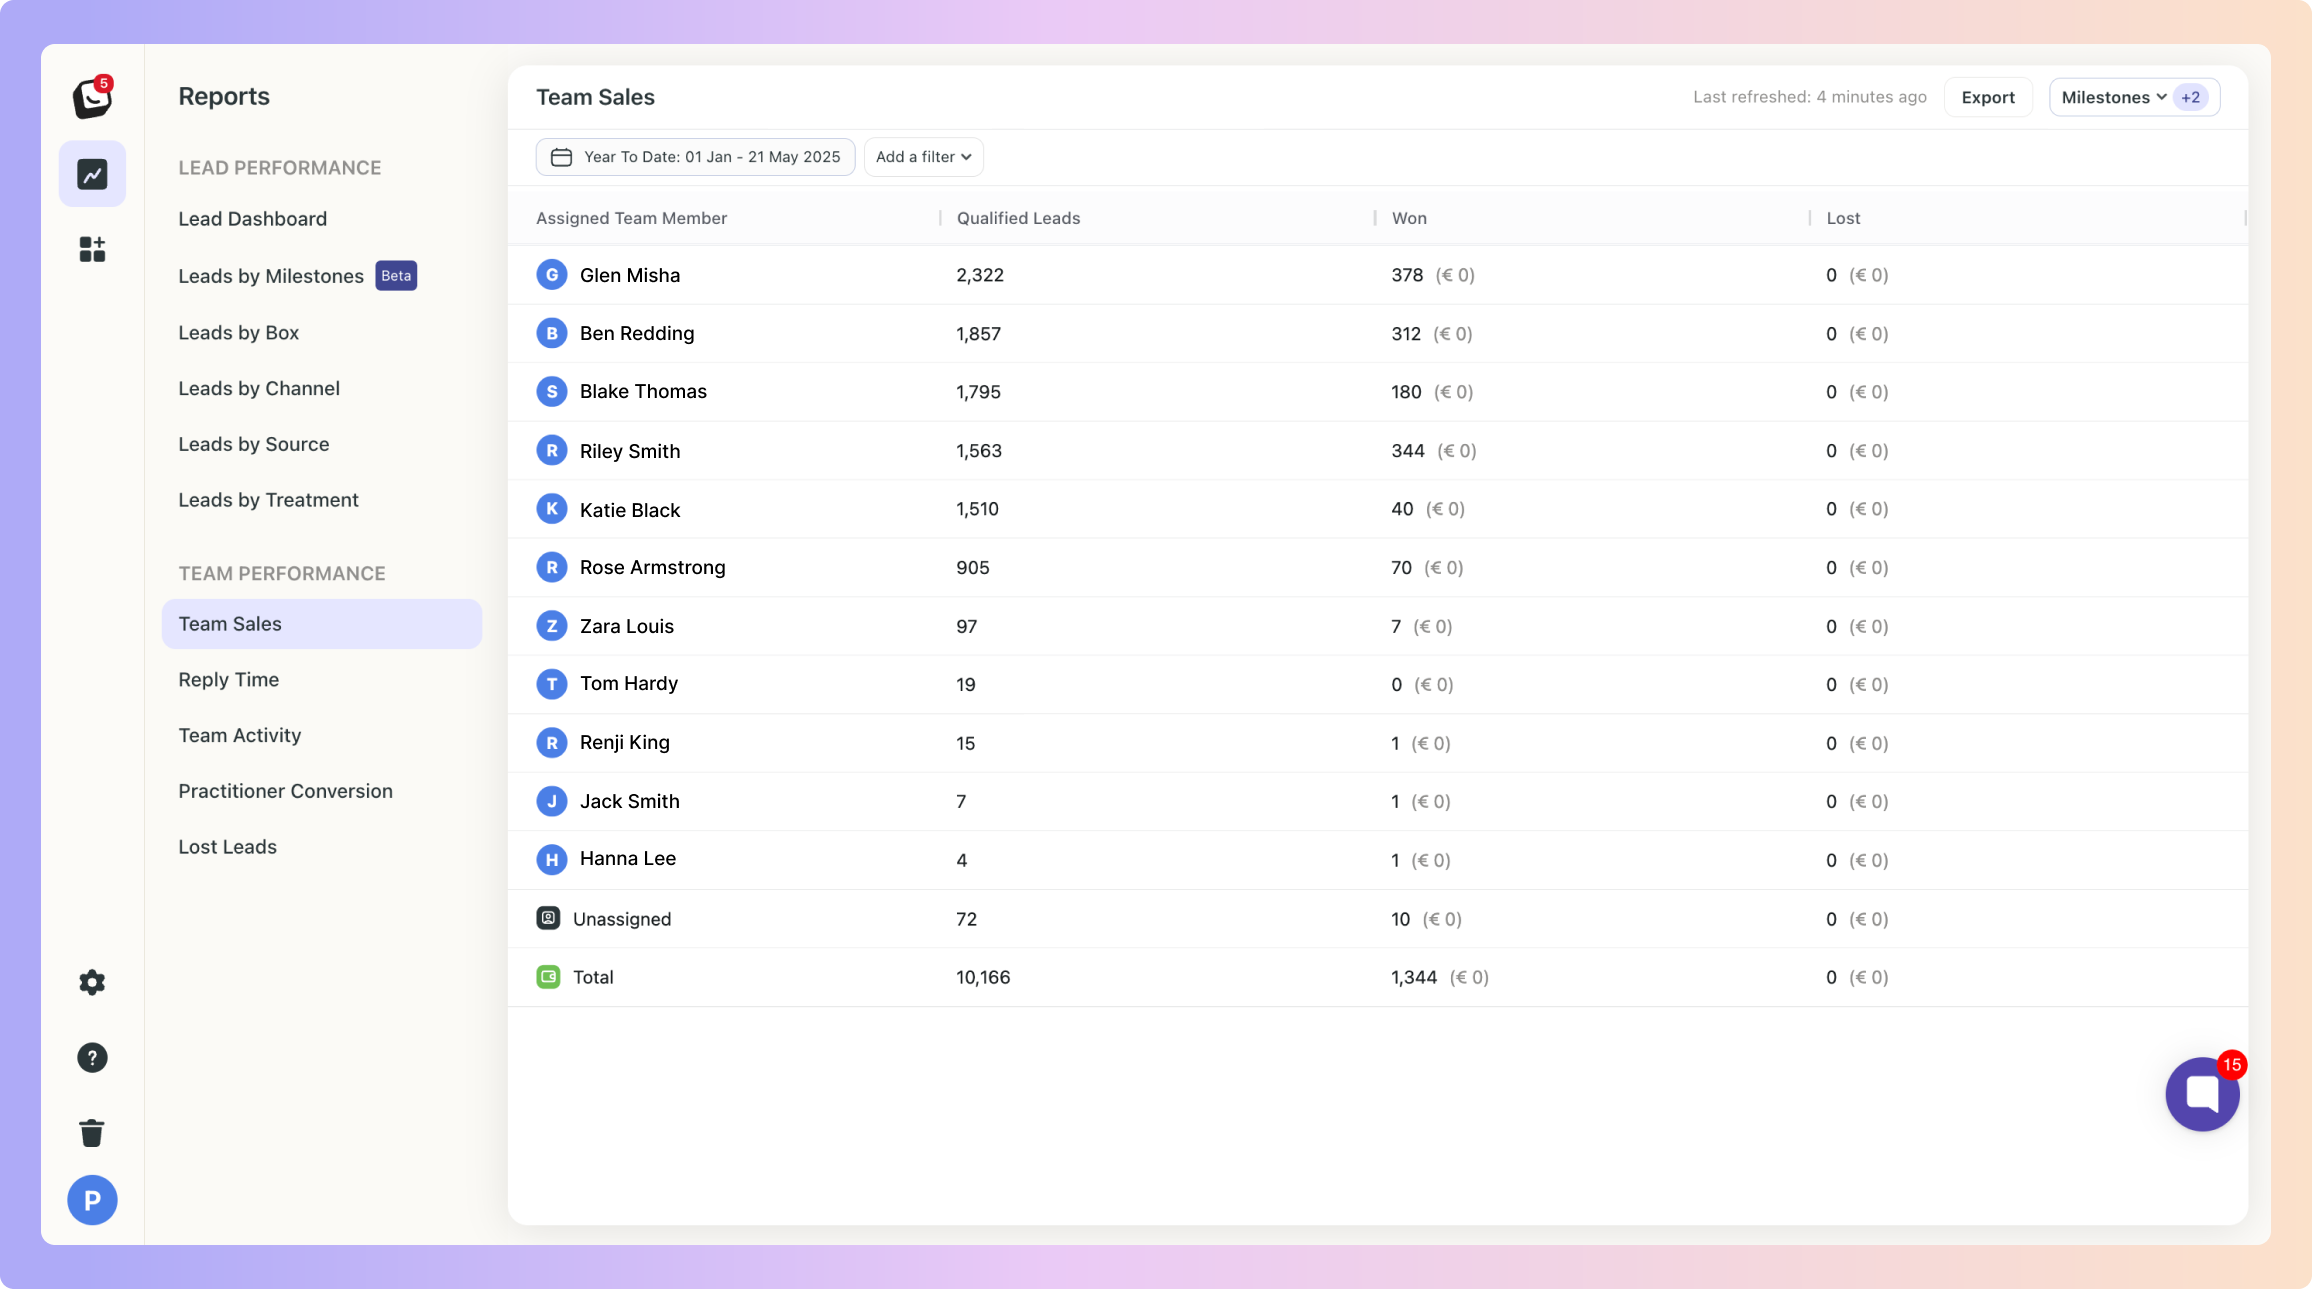
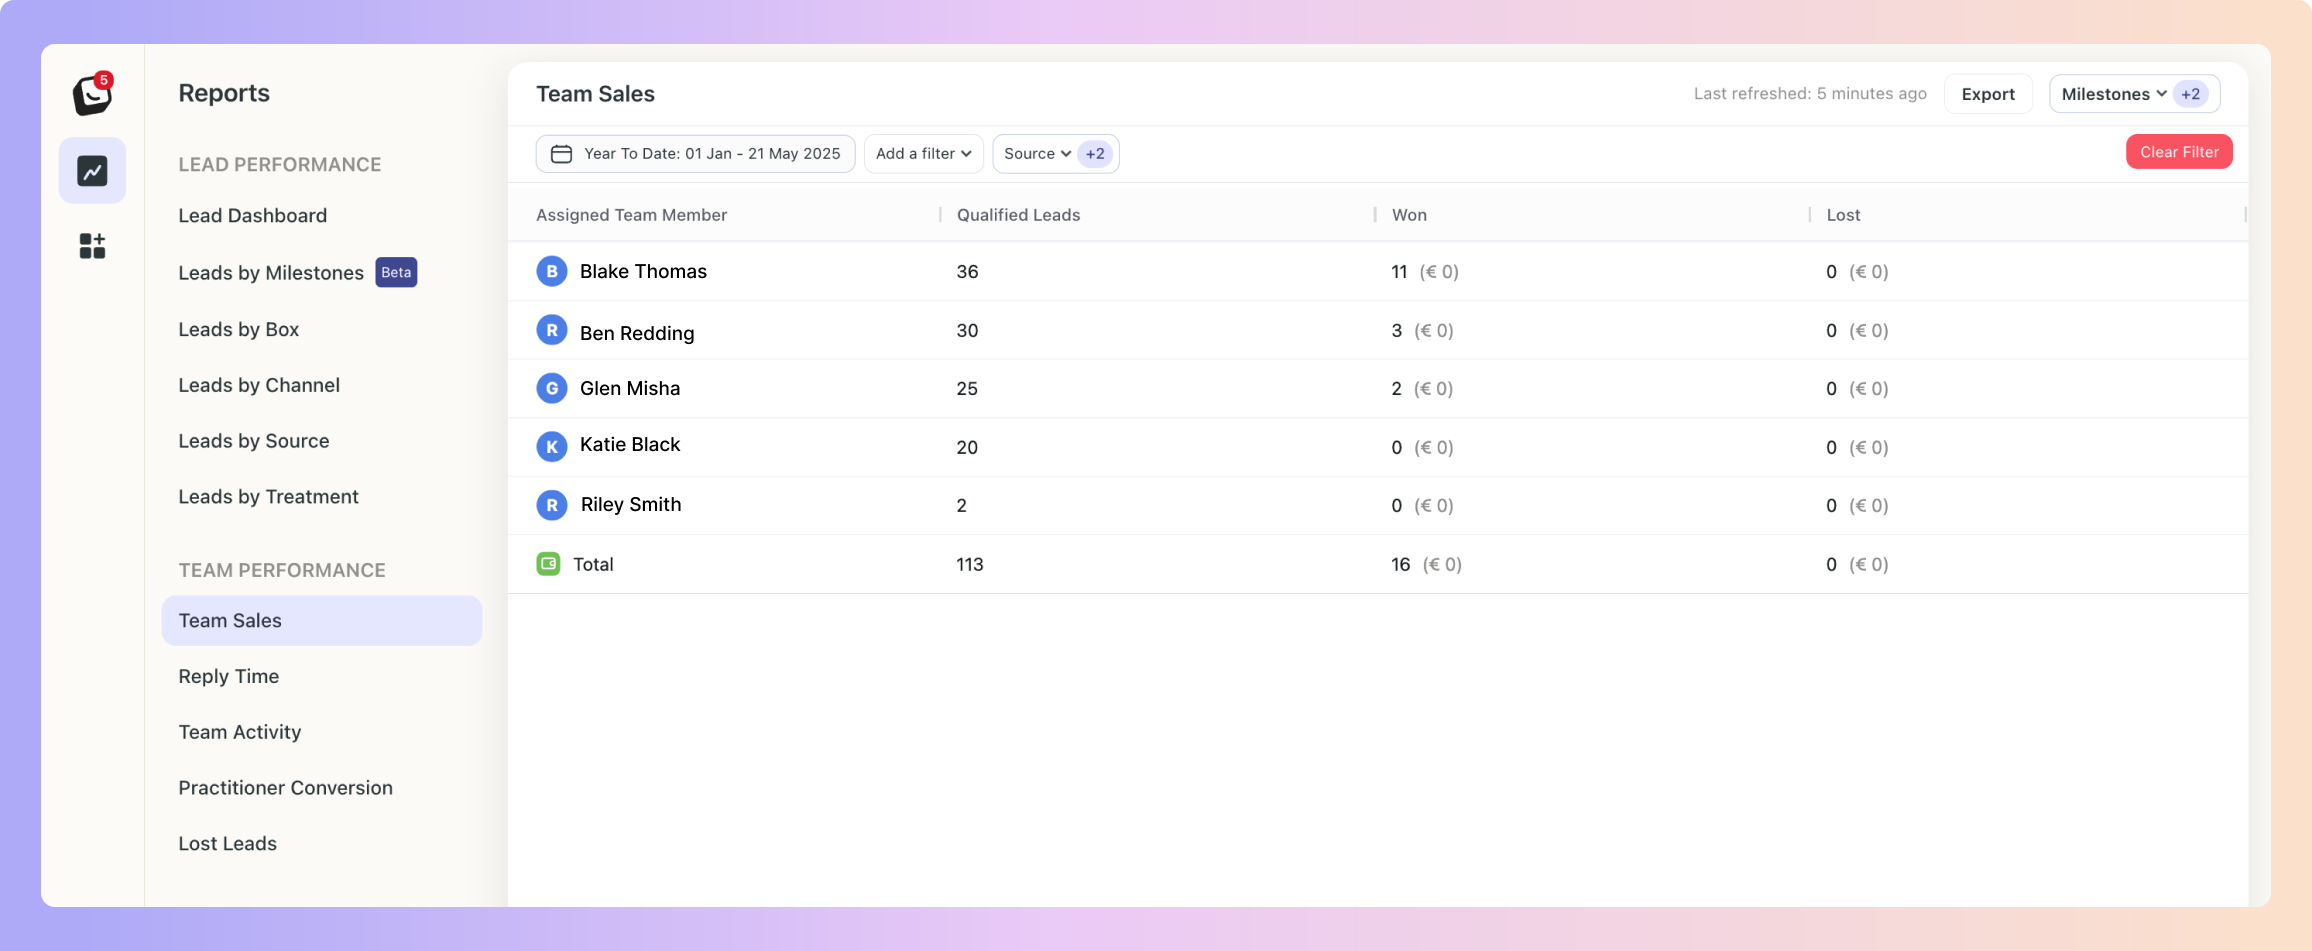
This report shows performance metrics for all team members, including an "Unassigned" category.
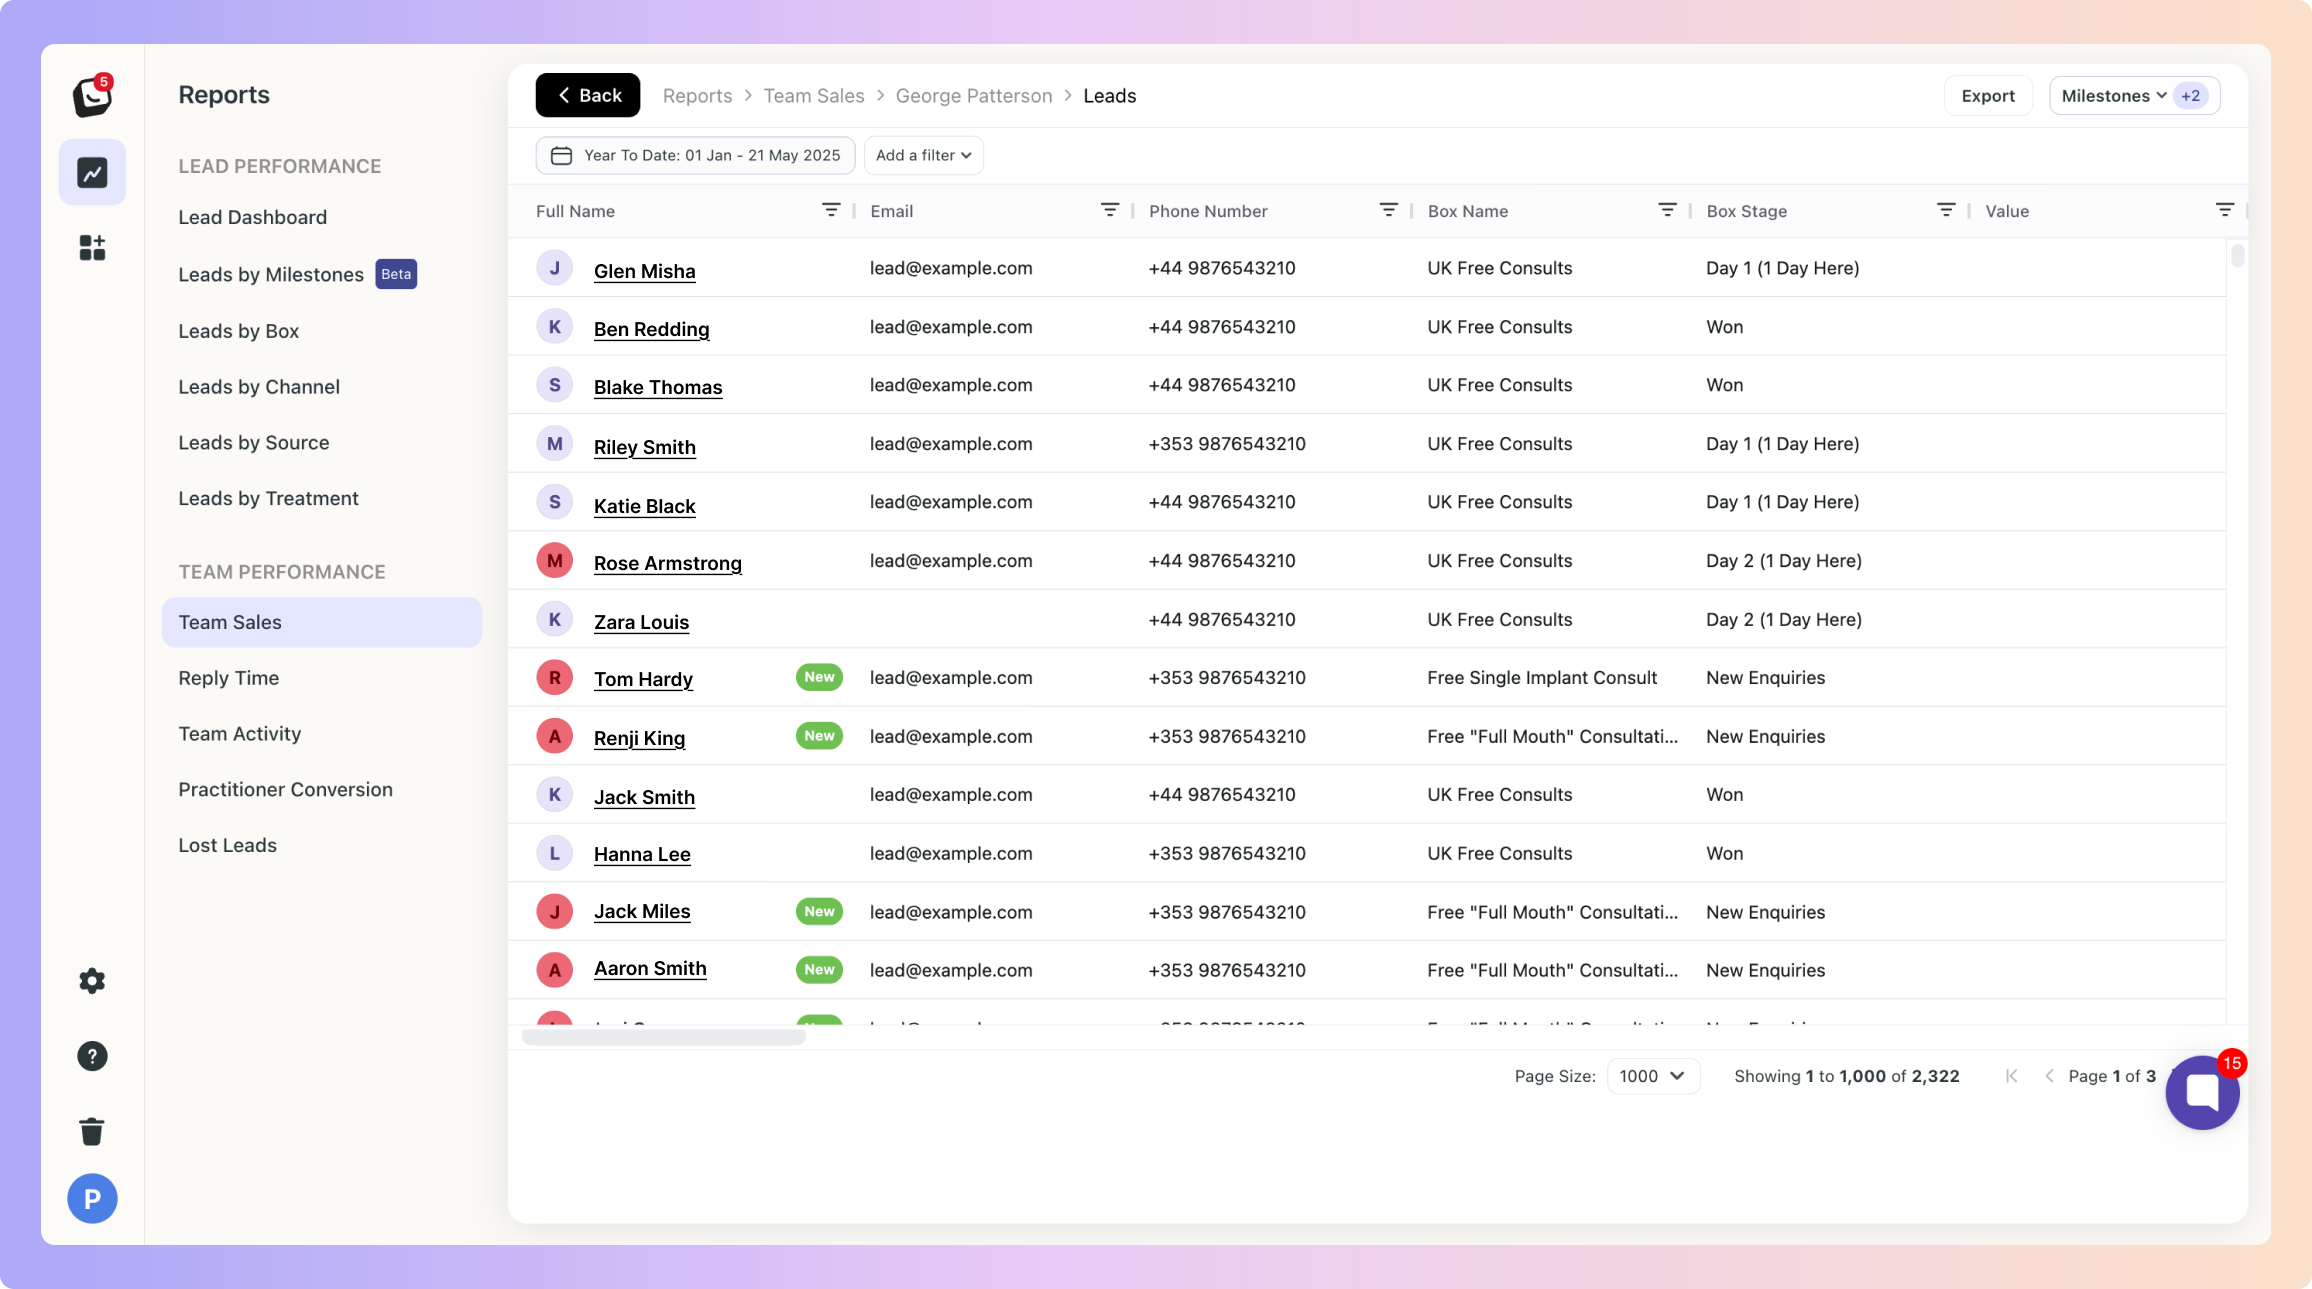
✅ Click on a team member or category to show the leads associated with that team member,
✅ You can select milestones to display additional metrics.
✅ Available filters include: Lead source, Channel, Box, and Label.
Milestones are a flexible way to track all the meaningful moments that happen in your pipeline, they are the key checkpoints in your sales journey that help you measure lead progression.
They’re tied to your Boxly Stages, so as leads move through your pipeline, Boxly automatically tracks when they pass each milestone.
If you want to add the values of the milestones as columns to your view, simply click on the top “Milestones” button and select the milestone you want to display.
✅ Click on “Add Filter”
✅ Select the filter you want applied, like Sources
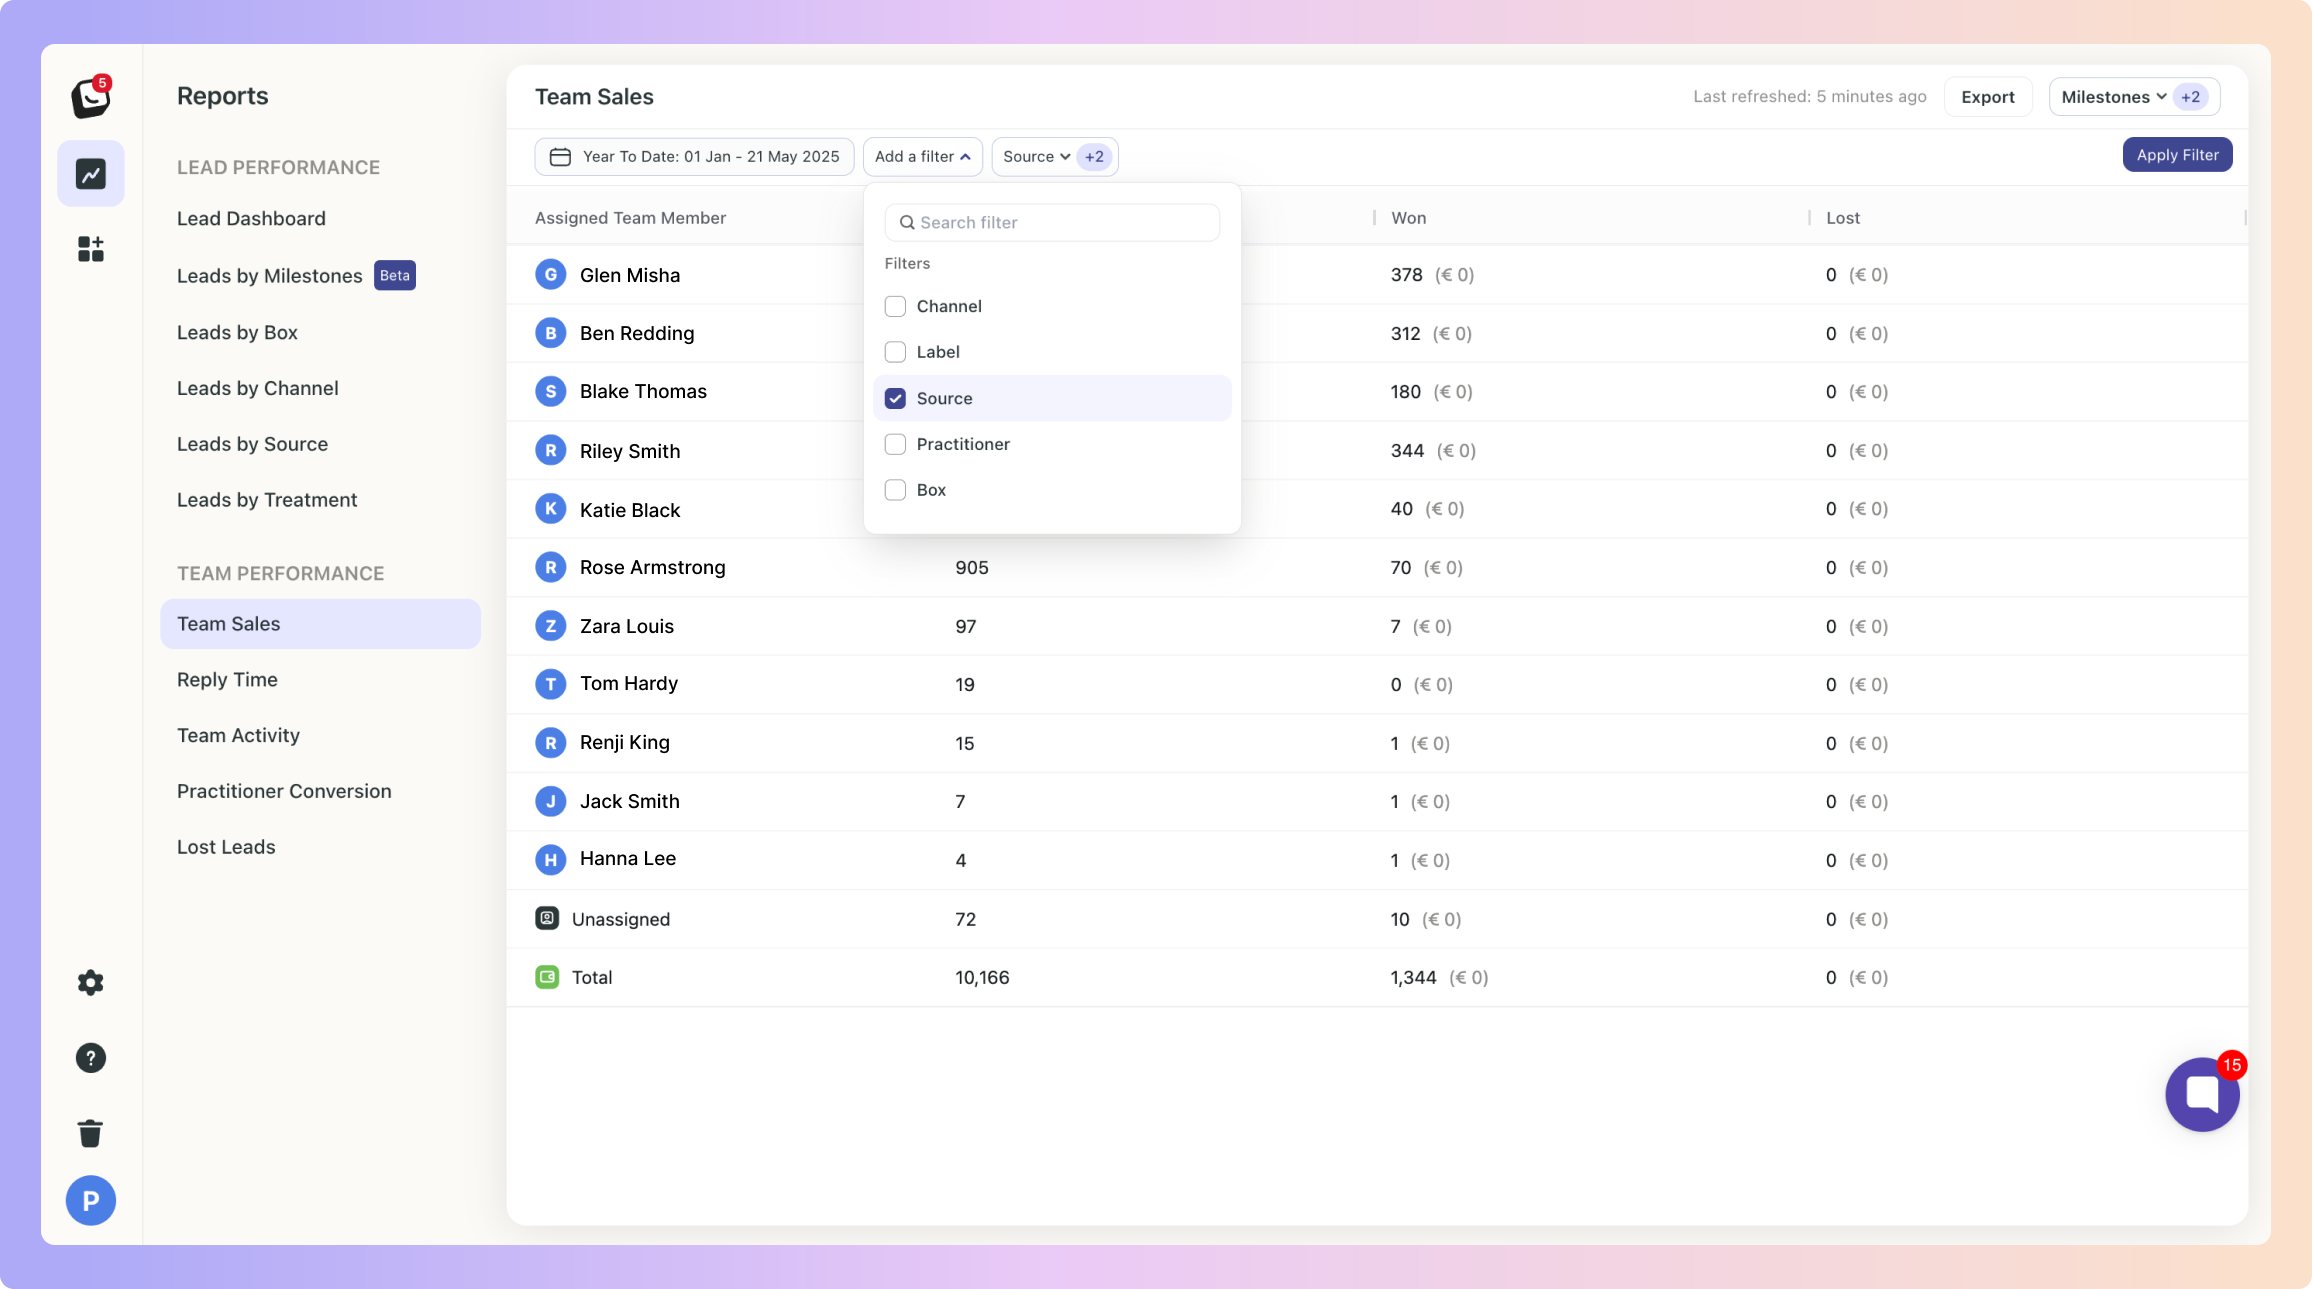
✅ The Filter options will appear next to “Add Filter”, select the specific filter within the category you chose. You can choose as many as you want.
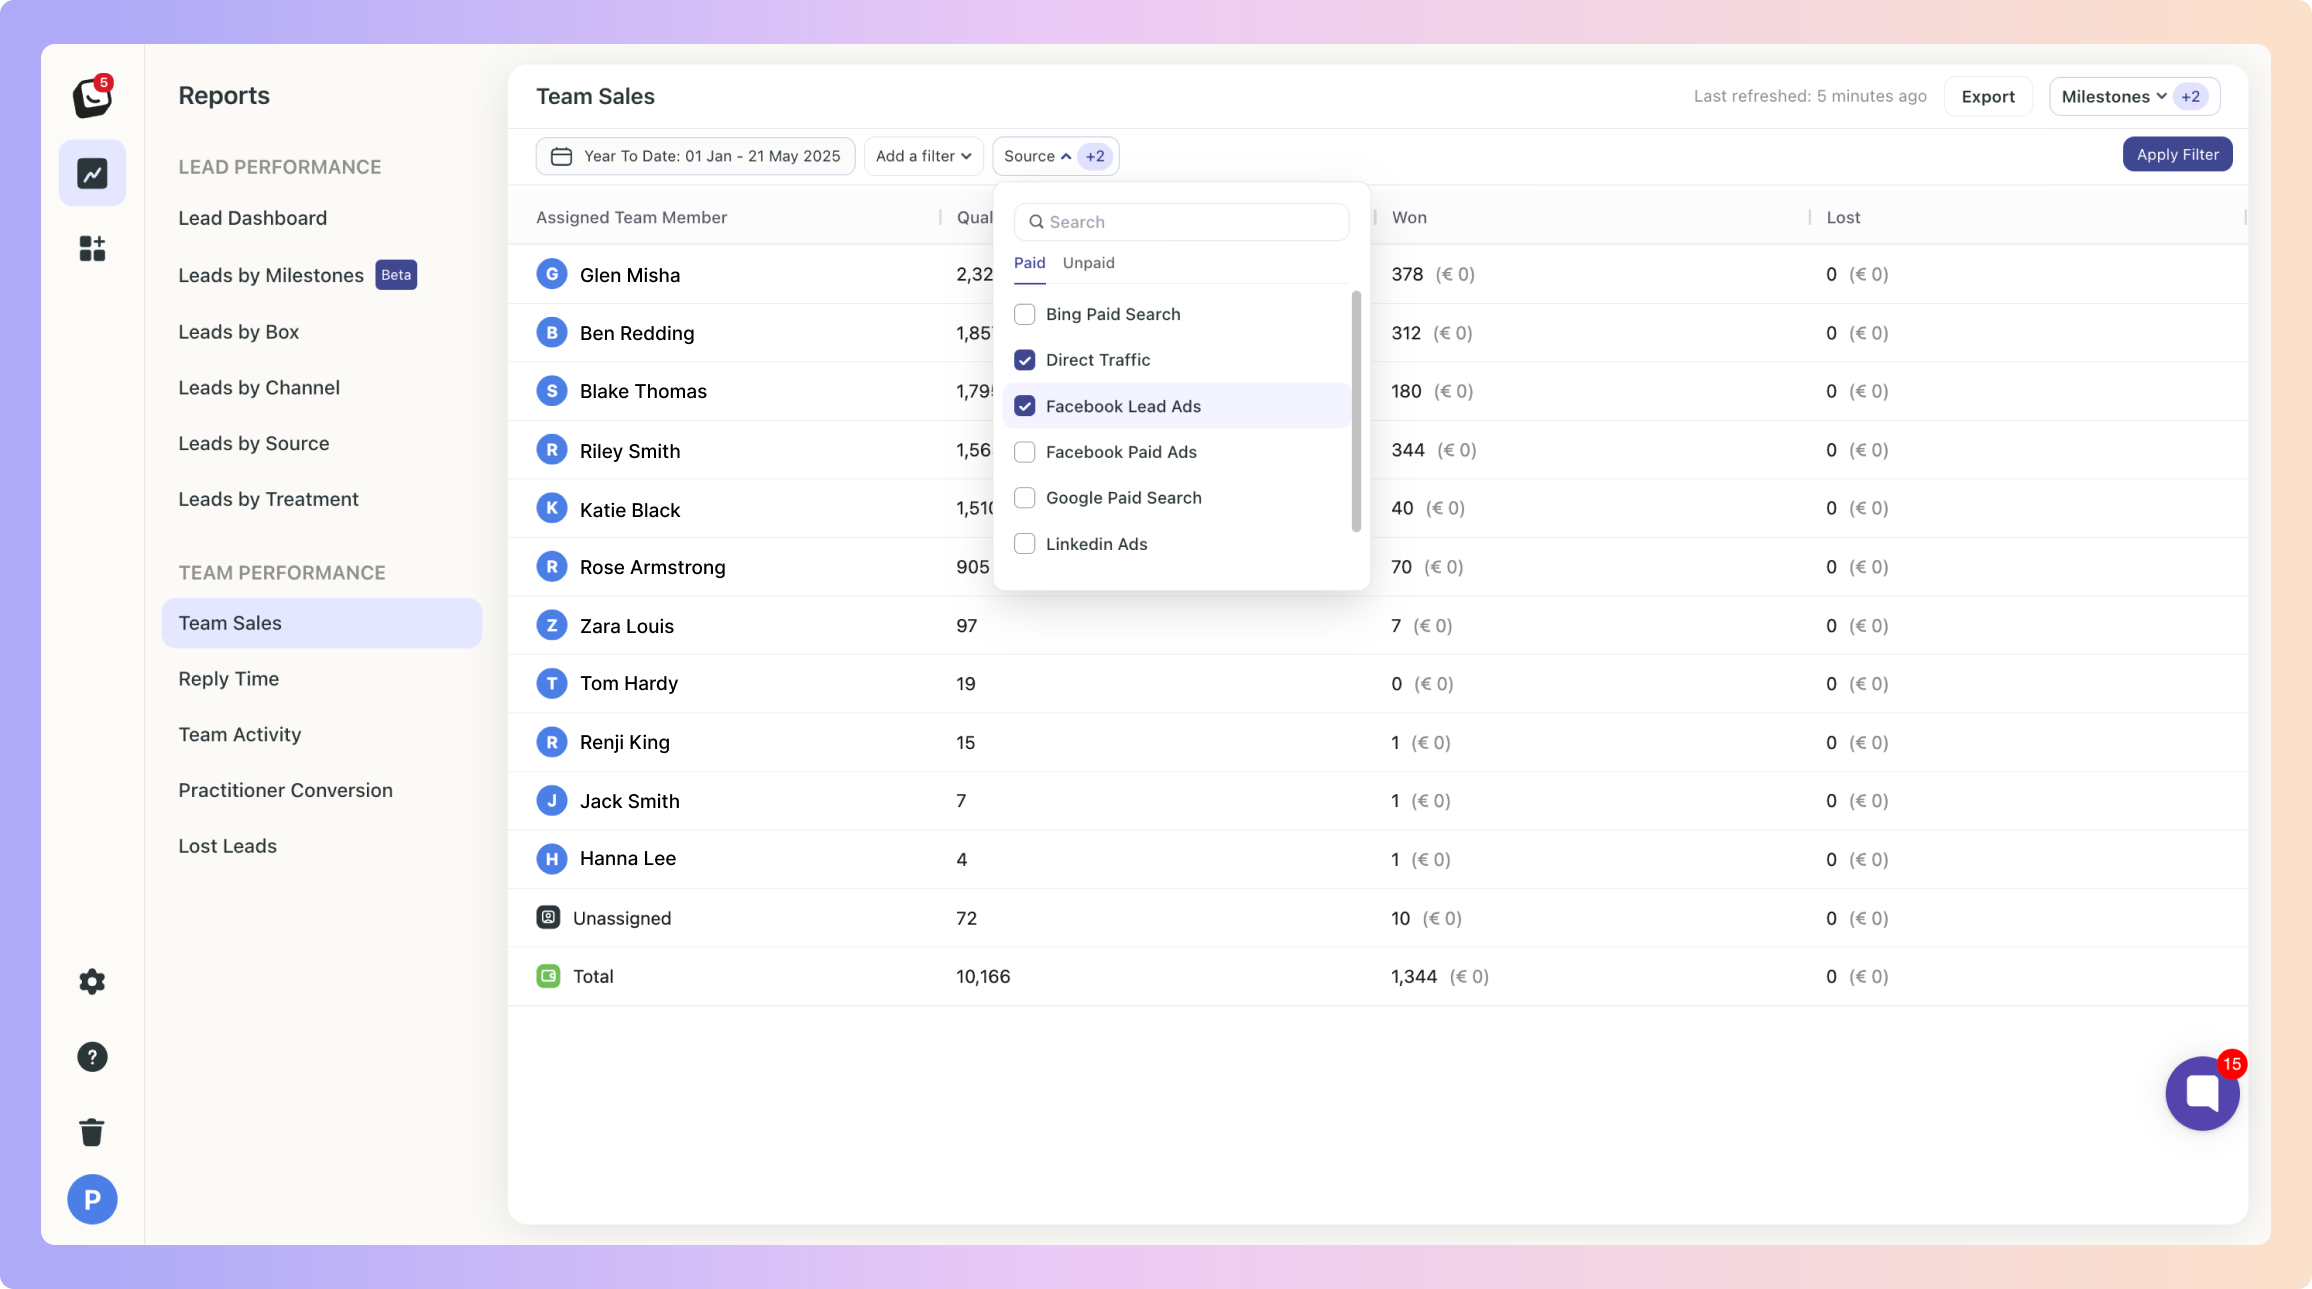
✅ Click “Apply Filter” button on the right and your filter will apply to your report, when you’re done simply click on the red “Clear Filter” button that appears once you’re in a filtered view.
✅ Click on “Date: Last 3 months”, the default time is Year To Date
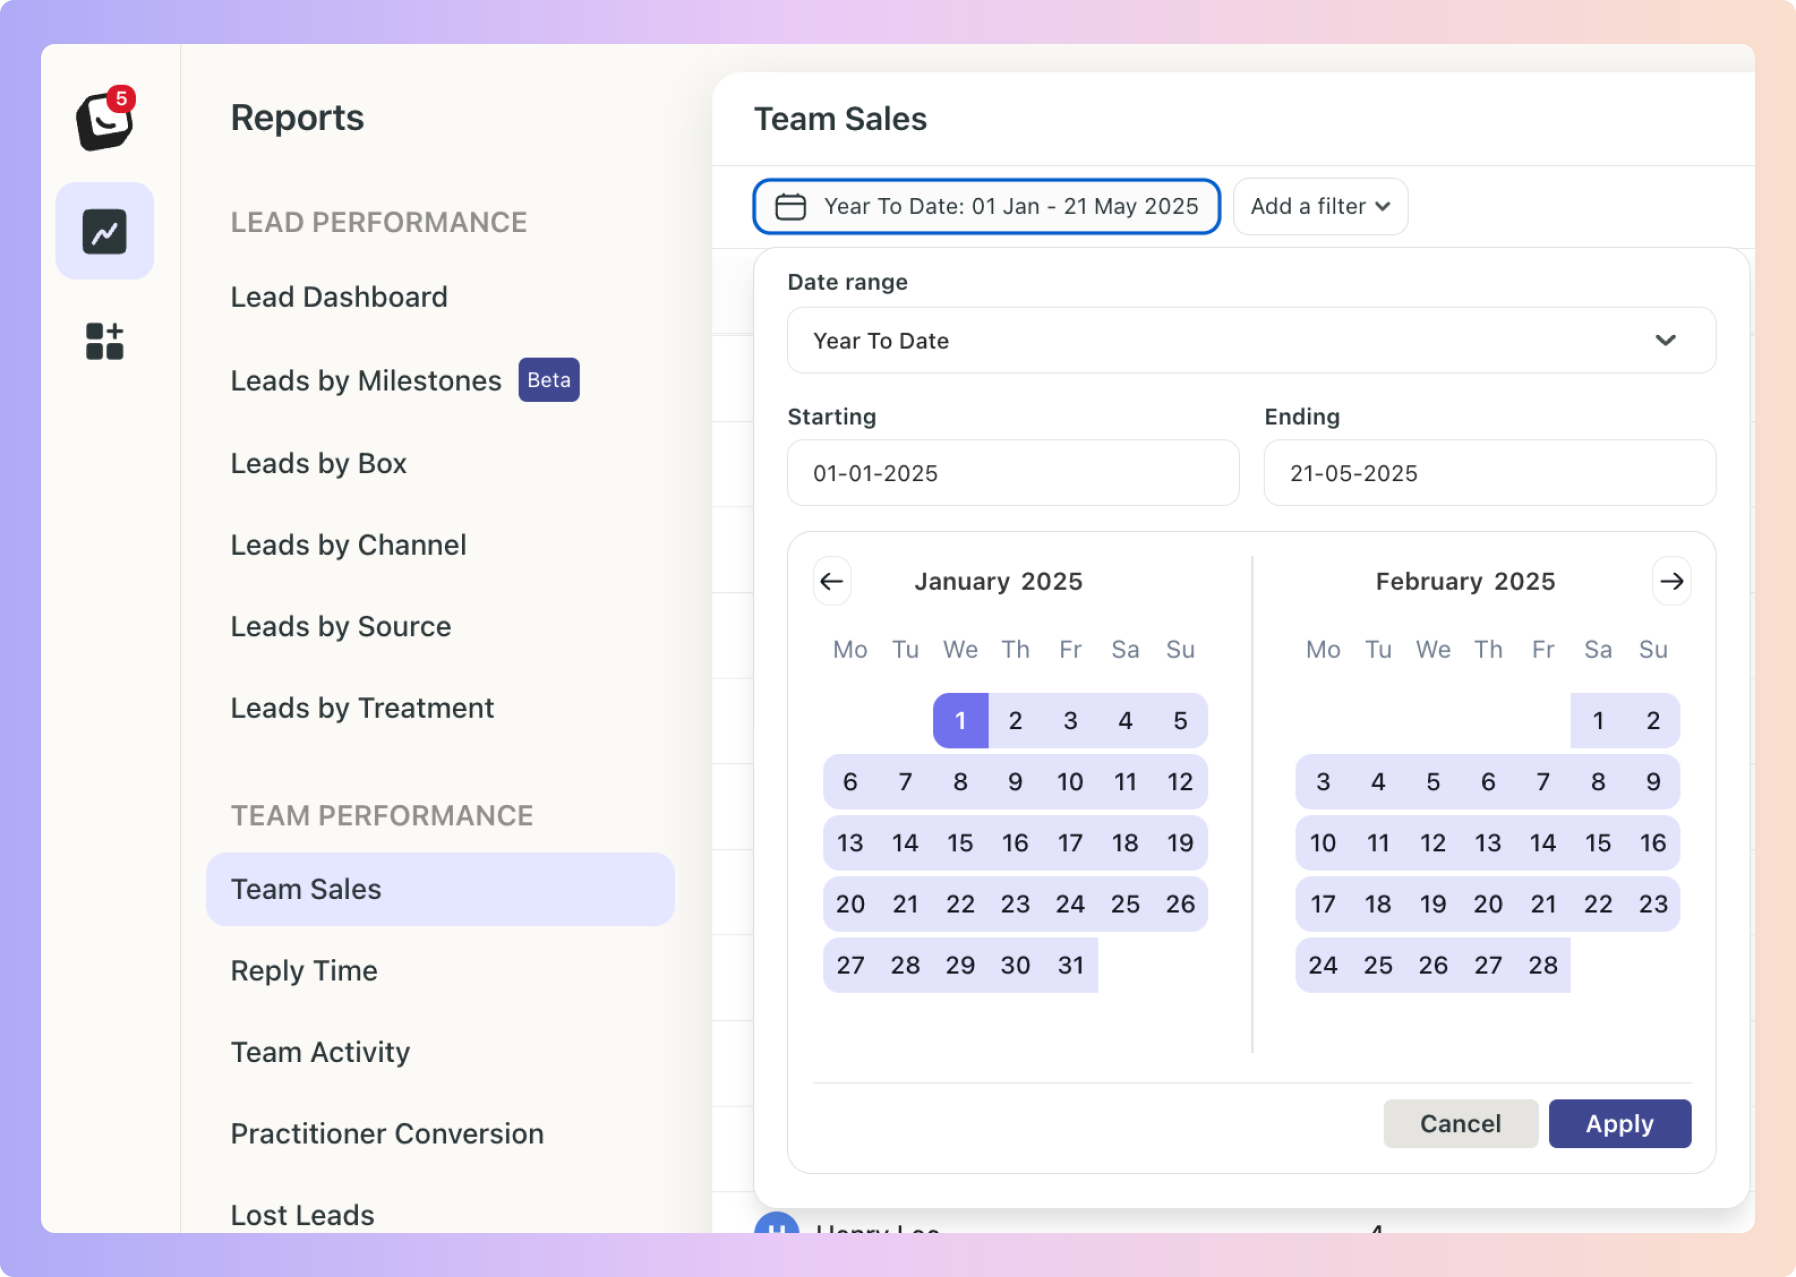
✅ Select the date you want applied as follows:
1. Date range -
Options include: Today, Yesterday, Last 7 Days, Last 30 Days, Last 90 Days, Month To Date, Week To Date, Quarter To Date, Year To Date, Last Week, Last Month, Last 3 Months, Last 6 Months, and All Time
2. Starting - Choose a date
3. Ending - Choose a date
✅ Click the “Apply” button
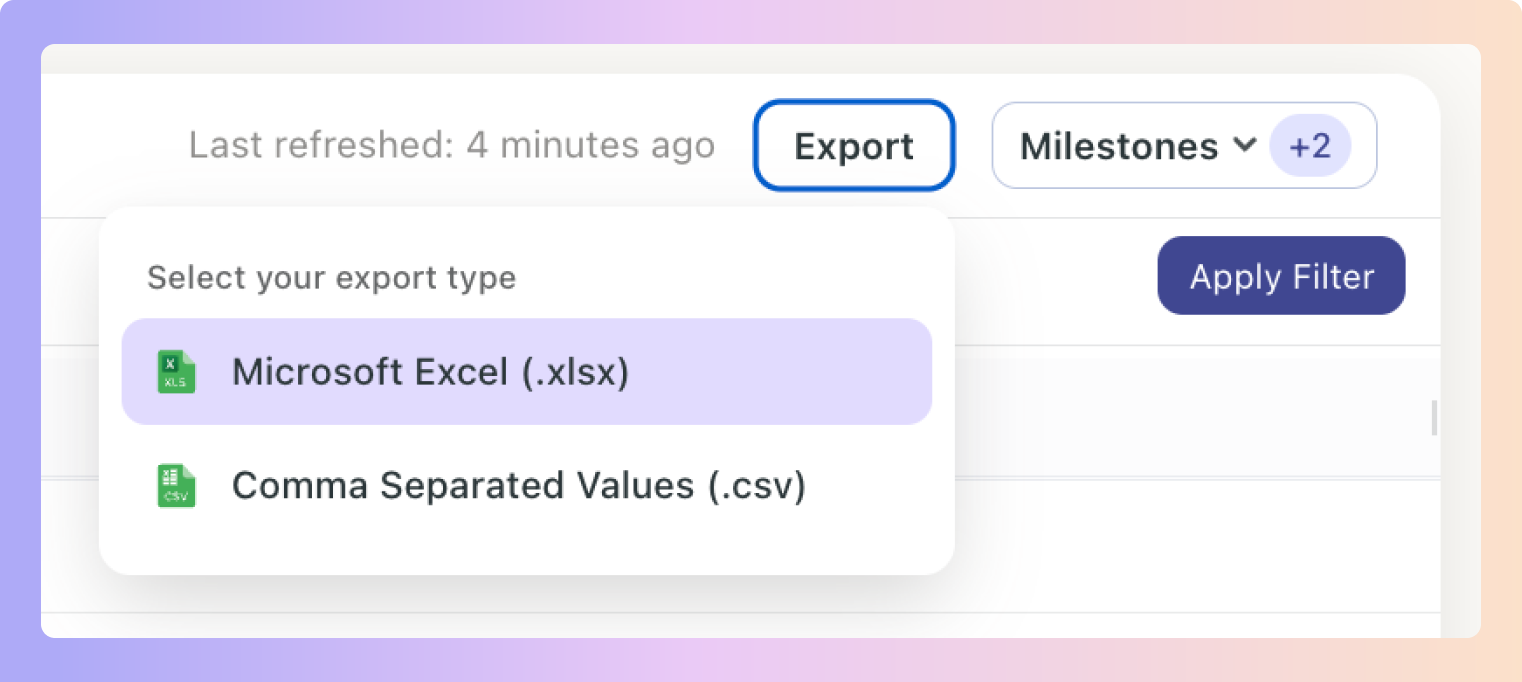
✅ Click on the top Export button to export your Referral report.
If any filters are active, your exported report will only reflect the data you’ve chosen.
In the example below, your Team Sales Report will be filtered by the filter you’ve chosen.
You can export into .csv & .xlsx

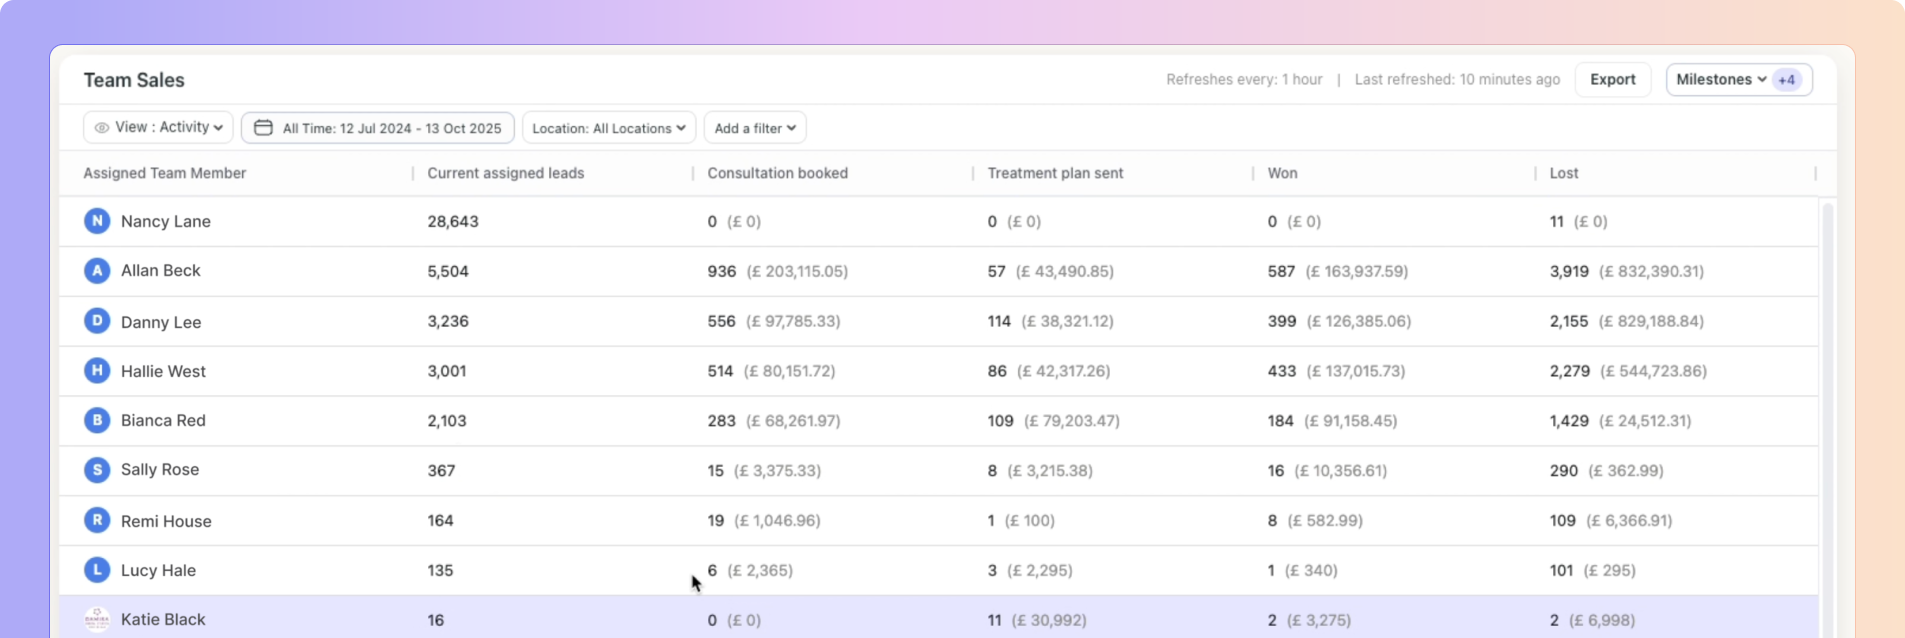
Previously, reports only had Cohort View, which showed data for leads created within the selected time period.
🧠 Example:
If a lead came in last month but booked a consultation this week, Activity View will now include it.
You can click the numbers such as “15 consultations booked” to see who those leads are, their current box, and stage.
Before, if a lead was reassigned, all milestone credit went to the new assignee.
Now each milestone records who actually moved the lead.
🧠 Example:
If Ava is assigned to the lead when it moves into Consultation Booked, she will keep credit for that milestone. If the same lead is later reassigned to Harvey and he moves it into the Won milestone, that milestone will count towards Harvey. The report will now correctly show one Consultation Booked by Ava and one Won by Harvey.
Old data has been corrected where possible.
✨ Going forward, all new data will be calculated accurately.
First Reply Average Response Time
This metric tracks how quickly your team responds to new leads.
It only measures the first reply on a brand-new lead.
Reassigned leads do not affect this stat.
It includes any action that counts as a response (reply, note, or call log).
In short: it’s how fast someone on your team first engages with a brand-new lead.
Overall Average Response Time (Coming Soon)
The timer starts when the lead comes in.
When a lead is reassigned, the response time for the new assignee is calculated from the customer’s last message, not from the lead’s original creation time.
🧠 Example:
If Becky replies first to a new lead, her response time is measured from when the lead came in to when she sends her first reply.If the same lead is later assigned to Danny, his response time is measured from the customer’s most recent message before his reply, ensuring only the time during his active engagement is counted.
Boxly is here to help you work smarter, not harder, let’s keep streamlining your lead management together!
Contact us at [email protected] if you need any assistance!