✅ Click on the Reporting icon in your left toolbar
✅ In the dropdown list of reports you’ll see on the left, click into the Reply Time Report to explore.
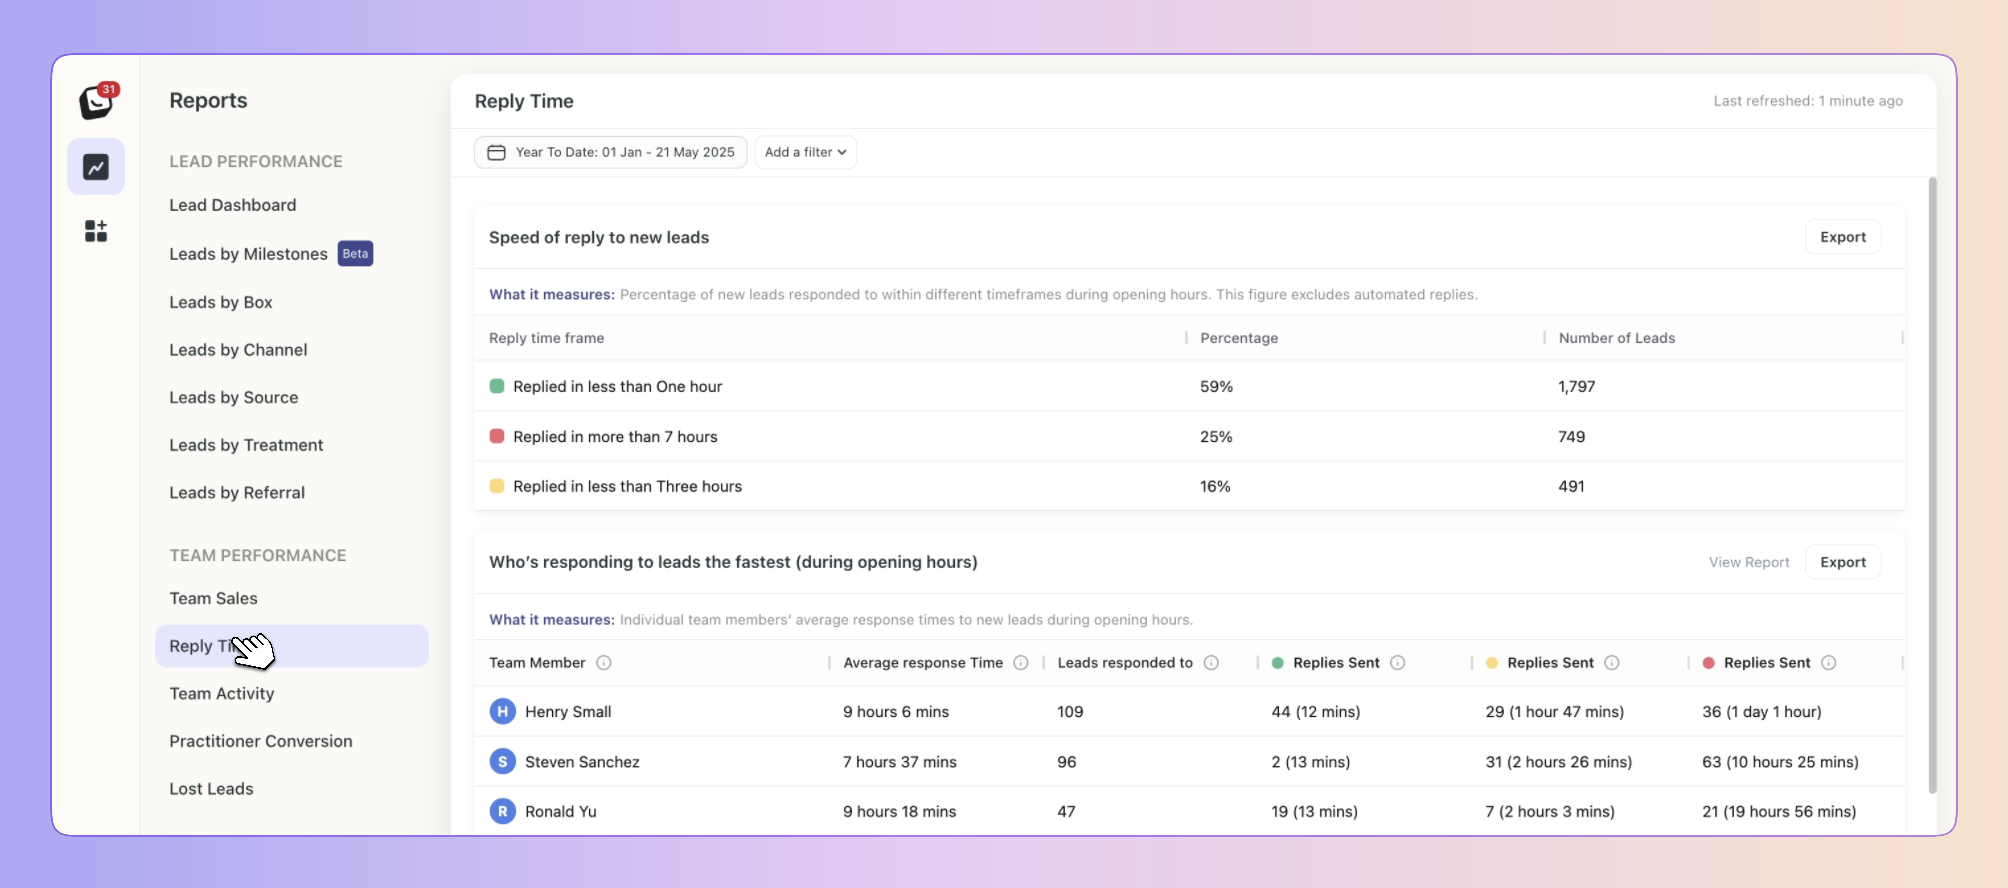
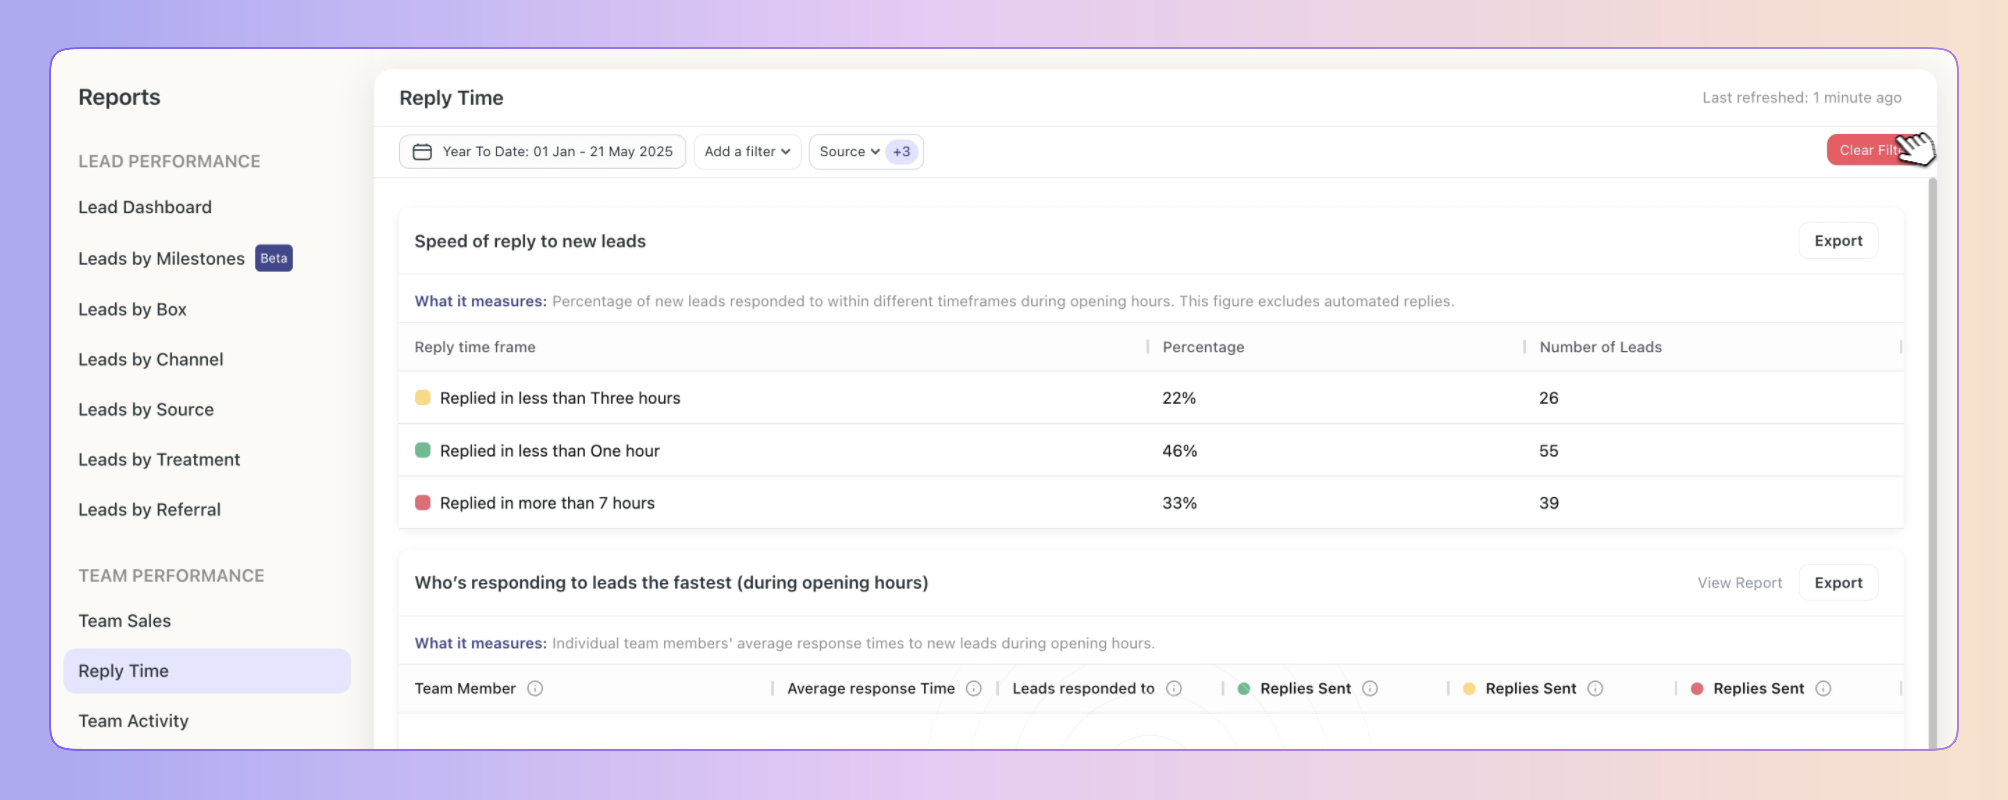
Your Reply Time Report shows you how your business is doing in terms of the time it takes for leads to be given attention, who’s responding the fastest, and the Channel that gets the best reply rate. This breakdown allows you to easily see how efficiently leads are being handled.
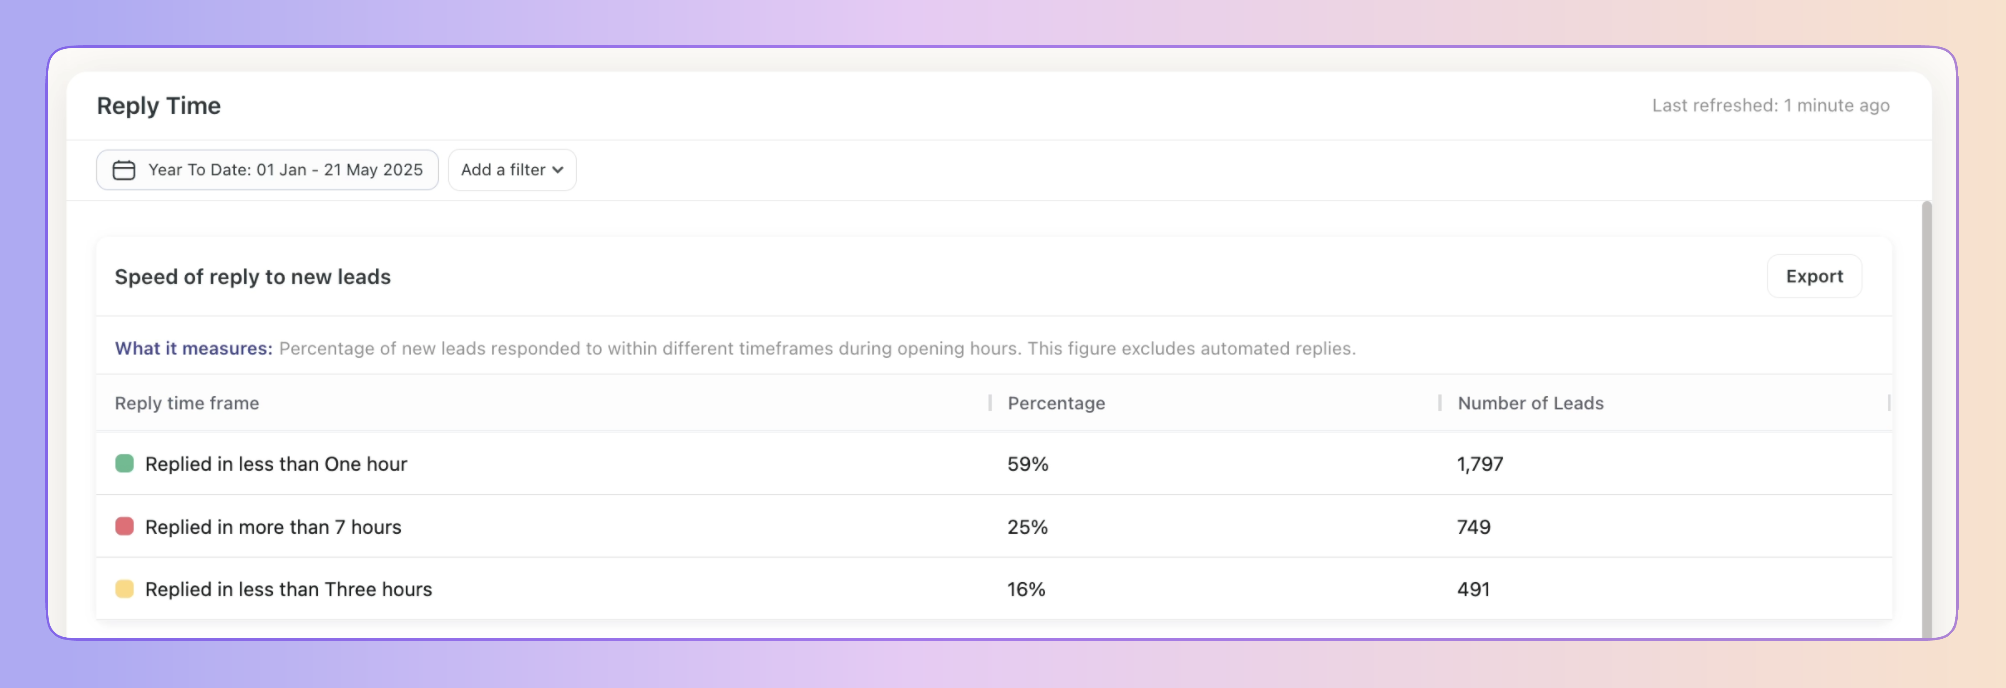
Here, we will track the replies made for leads based on follow-up times. We will only calculate the first reply sent, and based on the follow-up timer, we will show when the reply was sent. We will also display the percentage of responses and the actual number of leads.
Your follow-up times are organised according to the follow-up times you set in Account settings. The Speed of Reply to New Leads report includes the percentage of leads and number of leads that stay in each of the follow-up time categories.
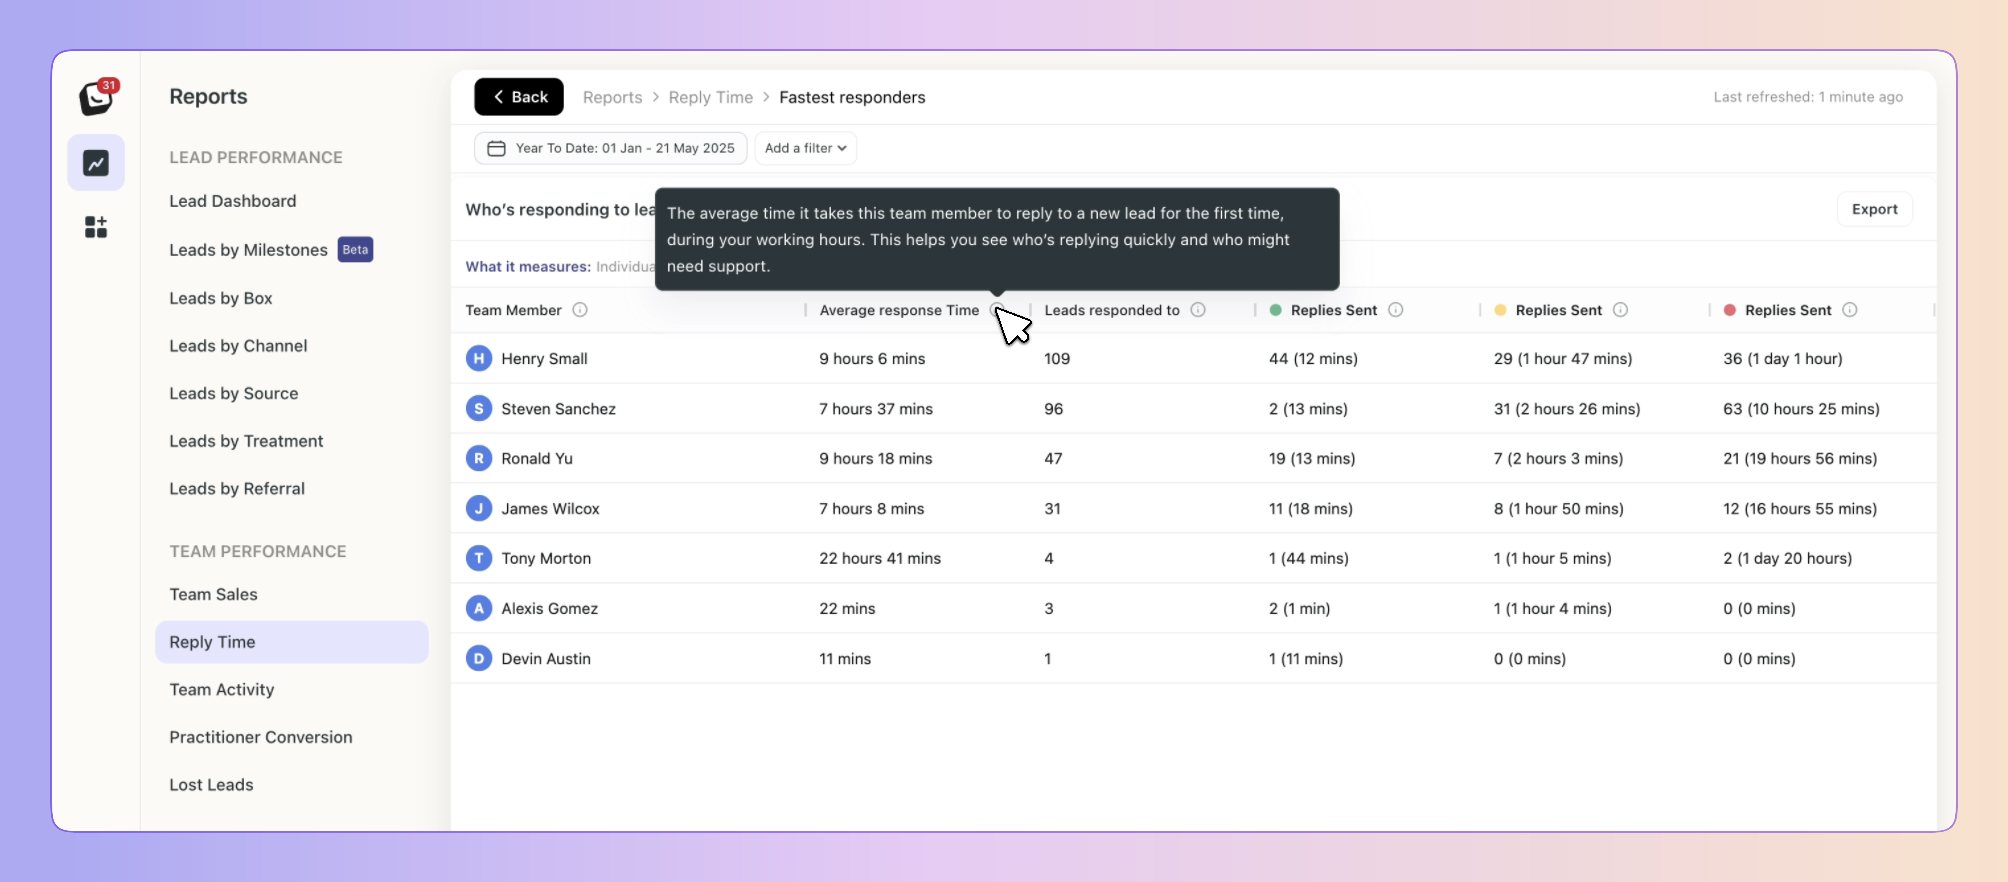
This section will show replies sent by you (and your team) during business hours. We will display the average response time, the number of new leads responded to, and the timing of replies based on the follow-up timer.
This report is split into:
Average response time,
Leads responded to,
Replies sent in each of your follow-up times categories.
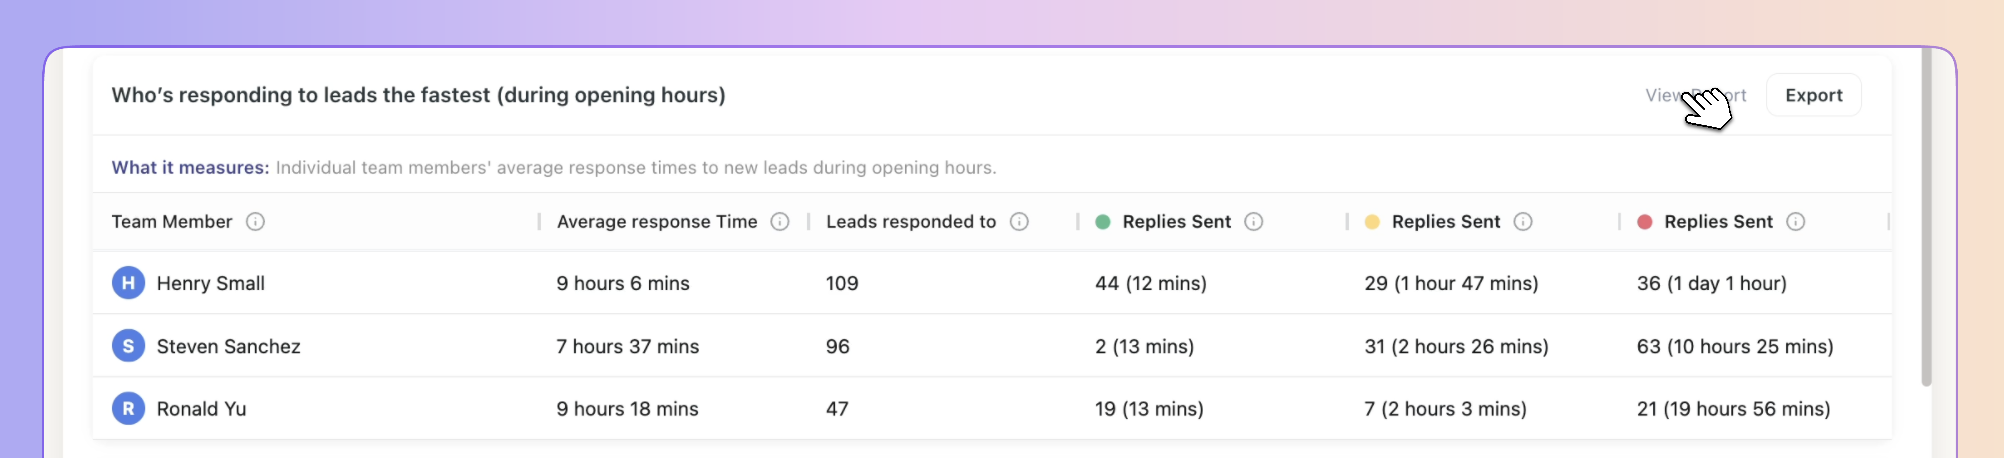
You can click into the Who’s Responding the Fastest report to see more details.
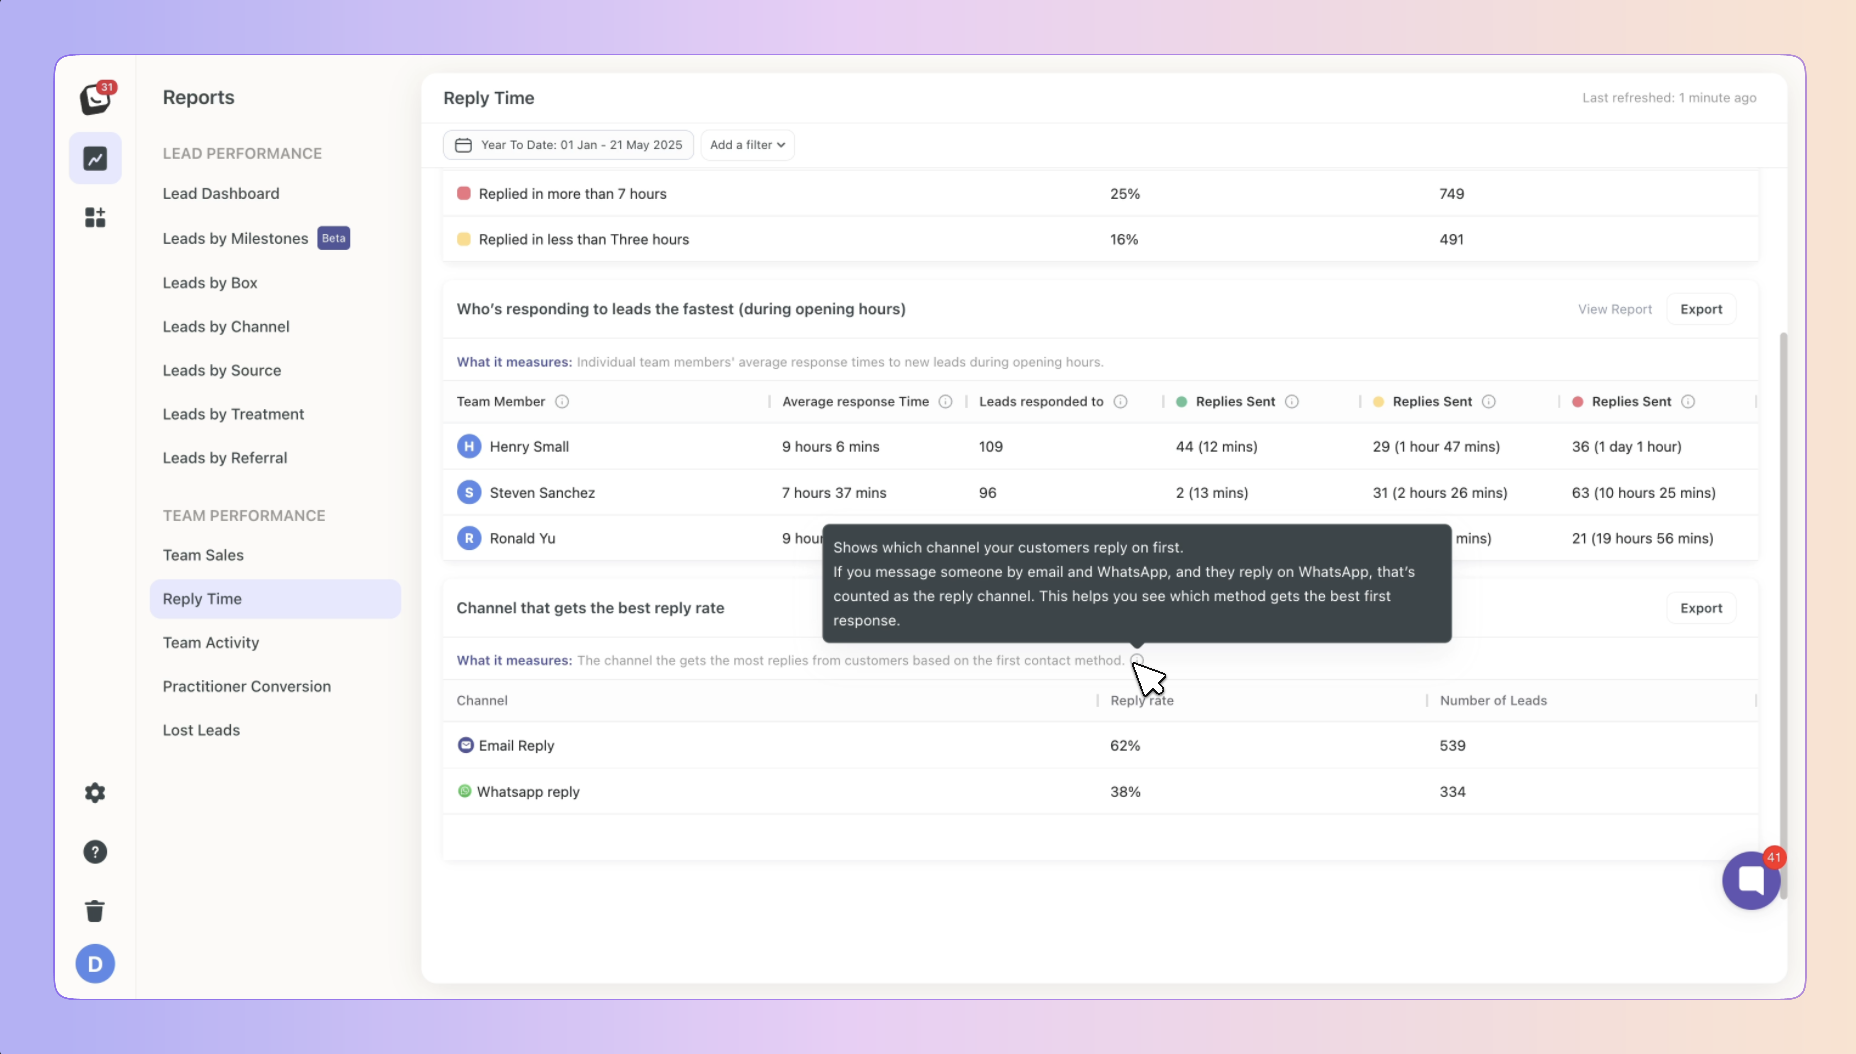
We will track three reply channels:
SMS, WhatsApp, and email. The goal is to determine which channel received the first reply.
For example:
If we sent 2 emails, 4 SMS, and 2 WhatsApp messages, and the customer replied via WhatsApp, we will count WhatsApp as the channel with the best reply rate.Here, we only calculate the first replies and the reply rate percentage.
When you send out a reply on Email and WhatsApp and the customer replies on WhatsApp, WhatsApp is then counted as the Reply channel. It helps you identify your most popular channels for communication.
✅ Available filters include: Lead source, Box, Channel, and Label.
✅ Click on “Add Filter”
✅ Select the filter you want applied, like Sources
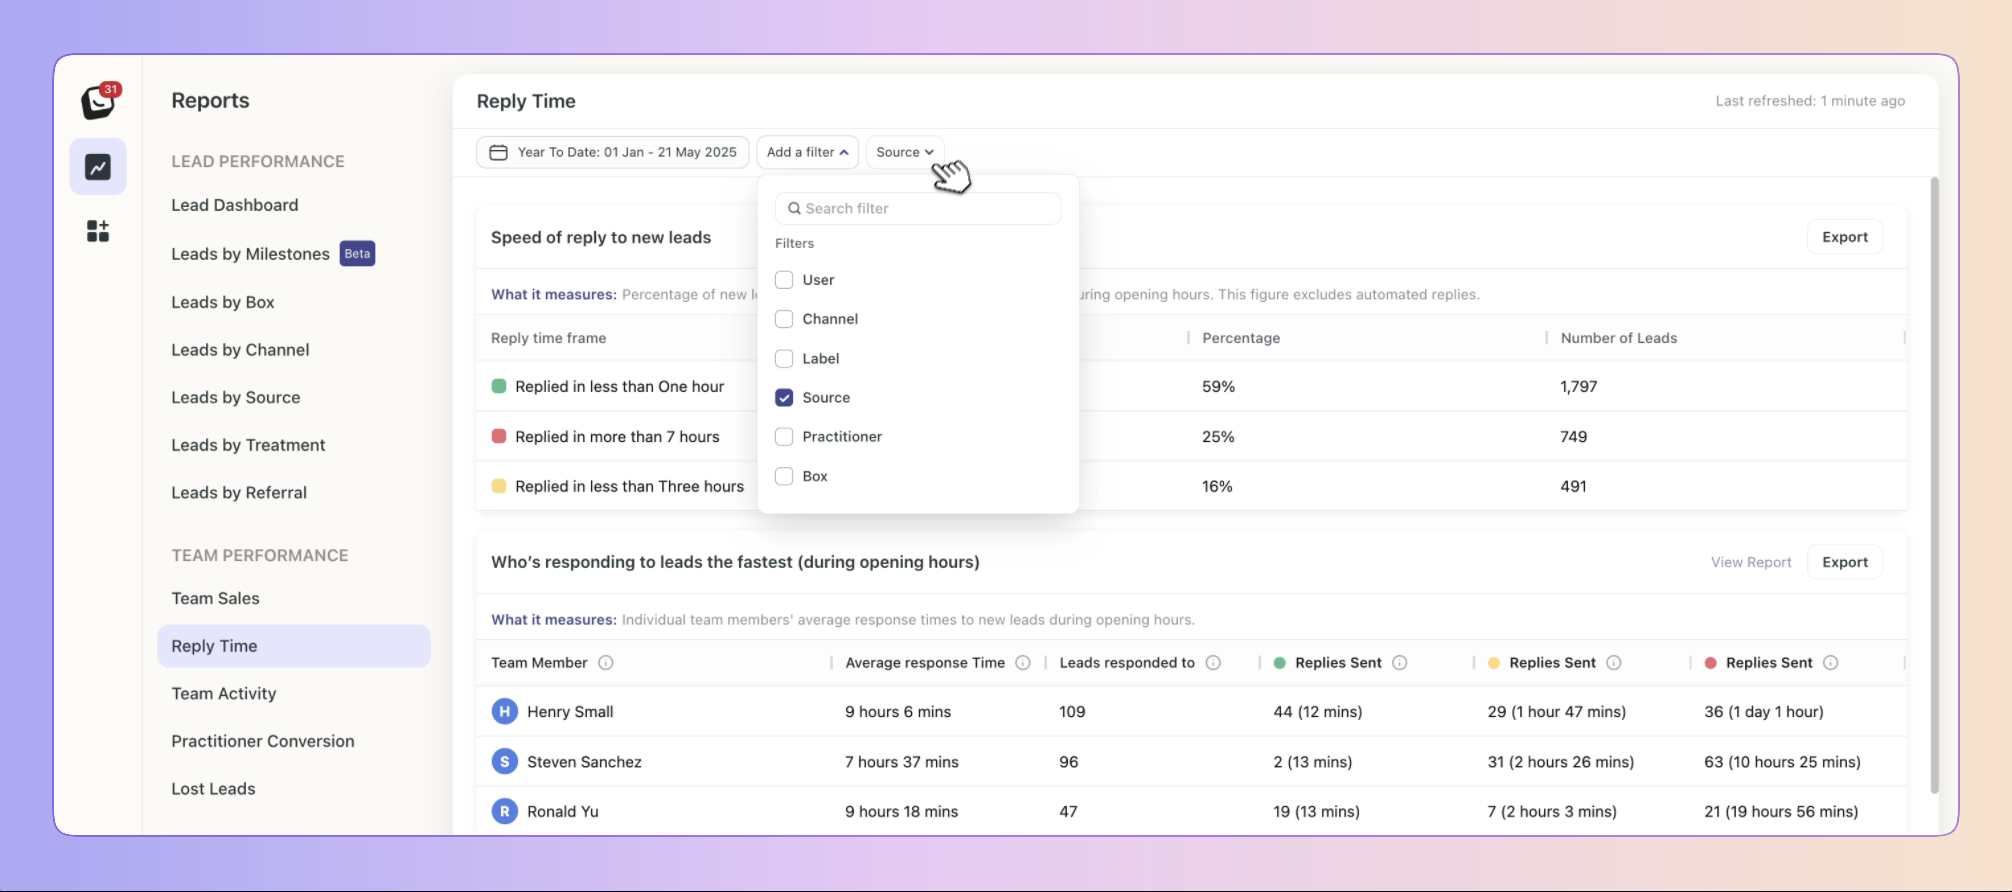
✅ The Filter’s options will appear next to “Add Filter”, select the specific filter within the category you chose. You can choose as many as you want.
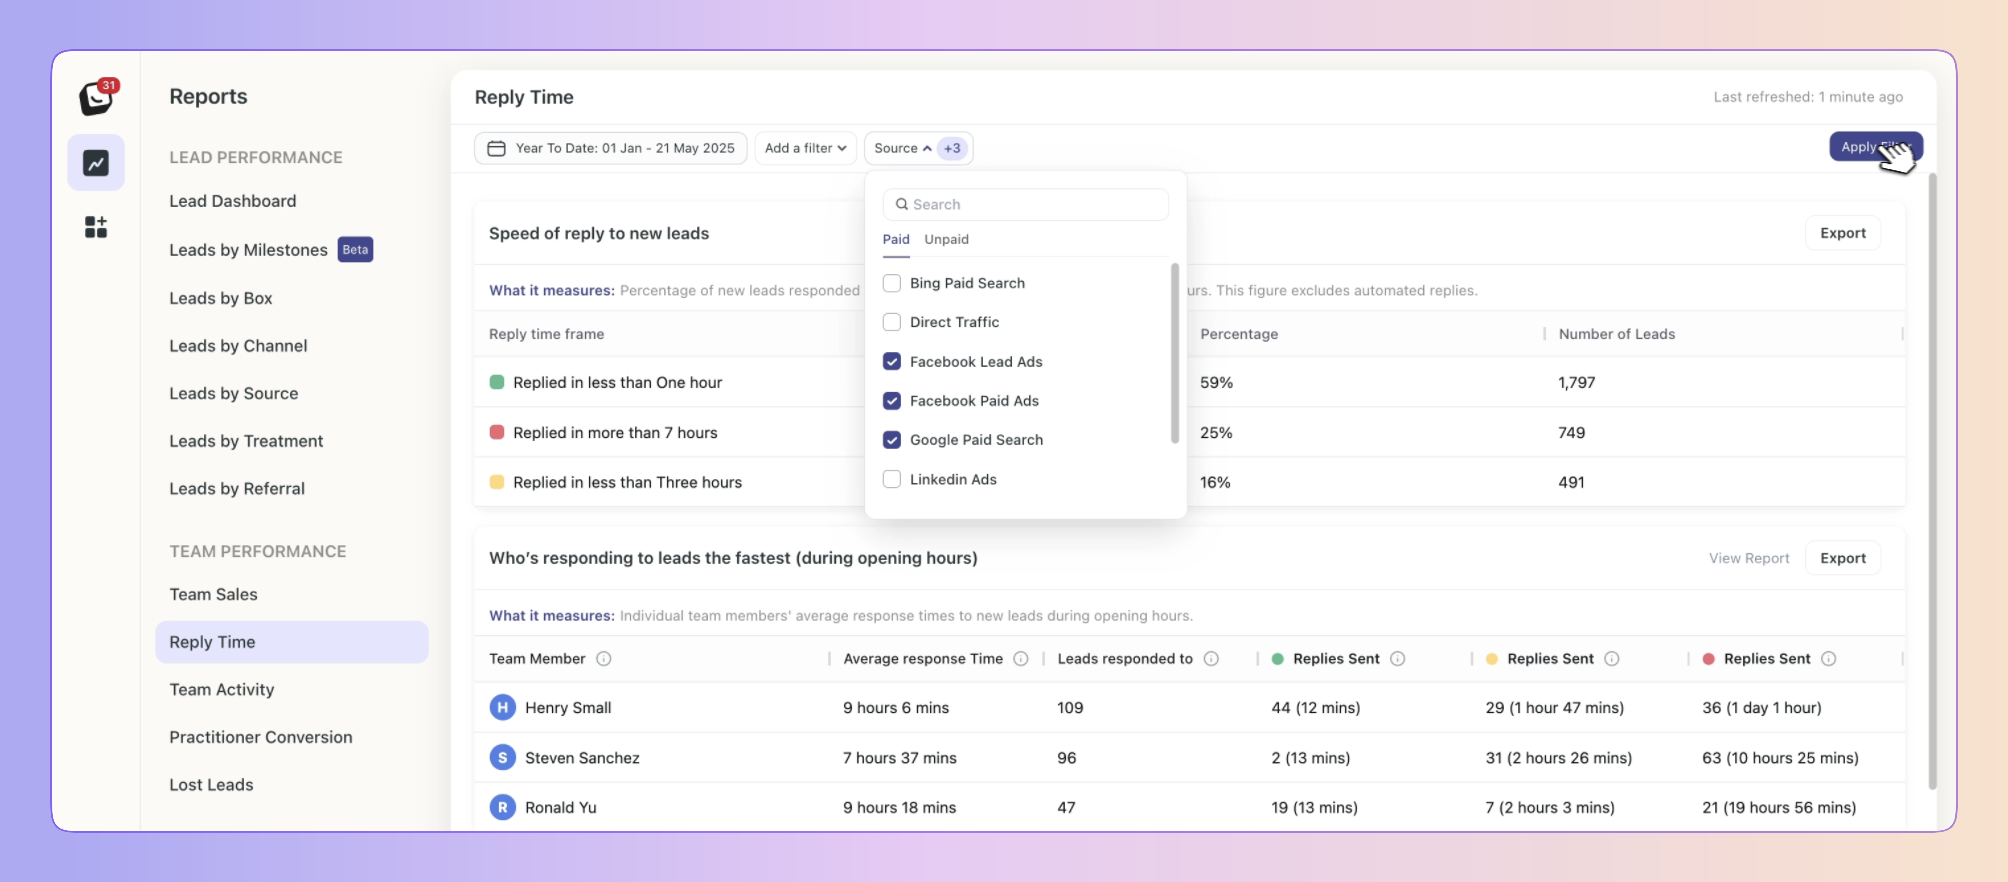
✅ Click “Apply Filter” button on the right and your filter will apply to your report, when you’re done simply click on the red “Clear Filter” button that appears once you’re in a filtered view.
✅ Click on “Date: Last 3 months”, the default time is the last 3 months
✅ Select the date you want applied as follows:
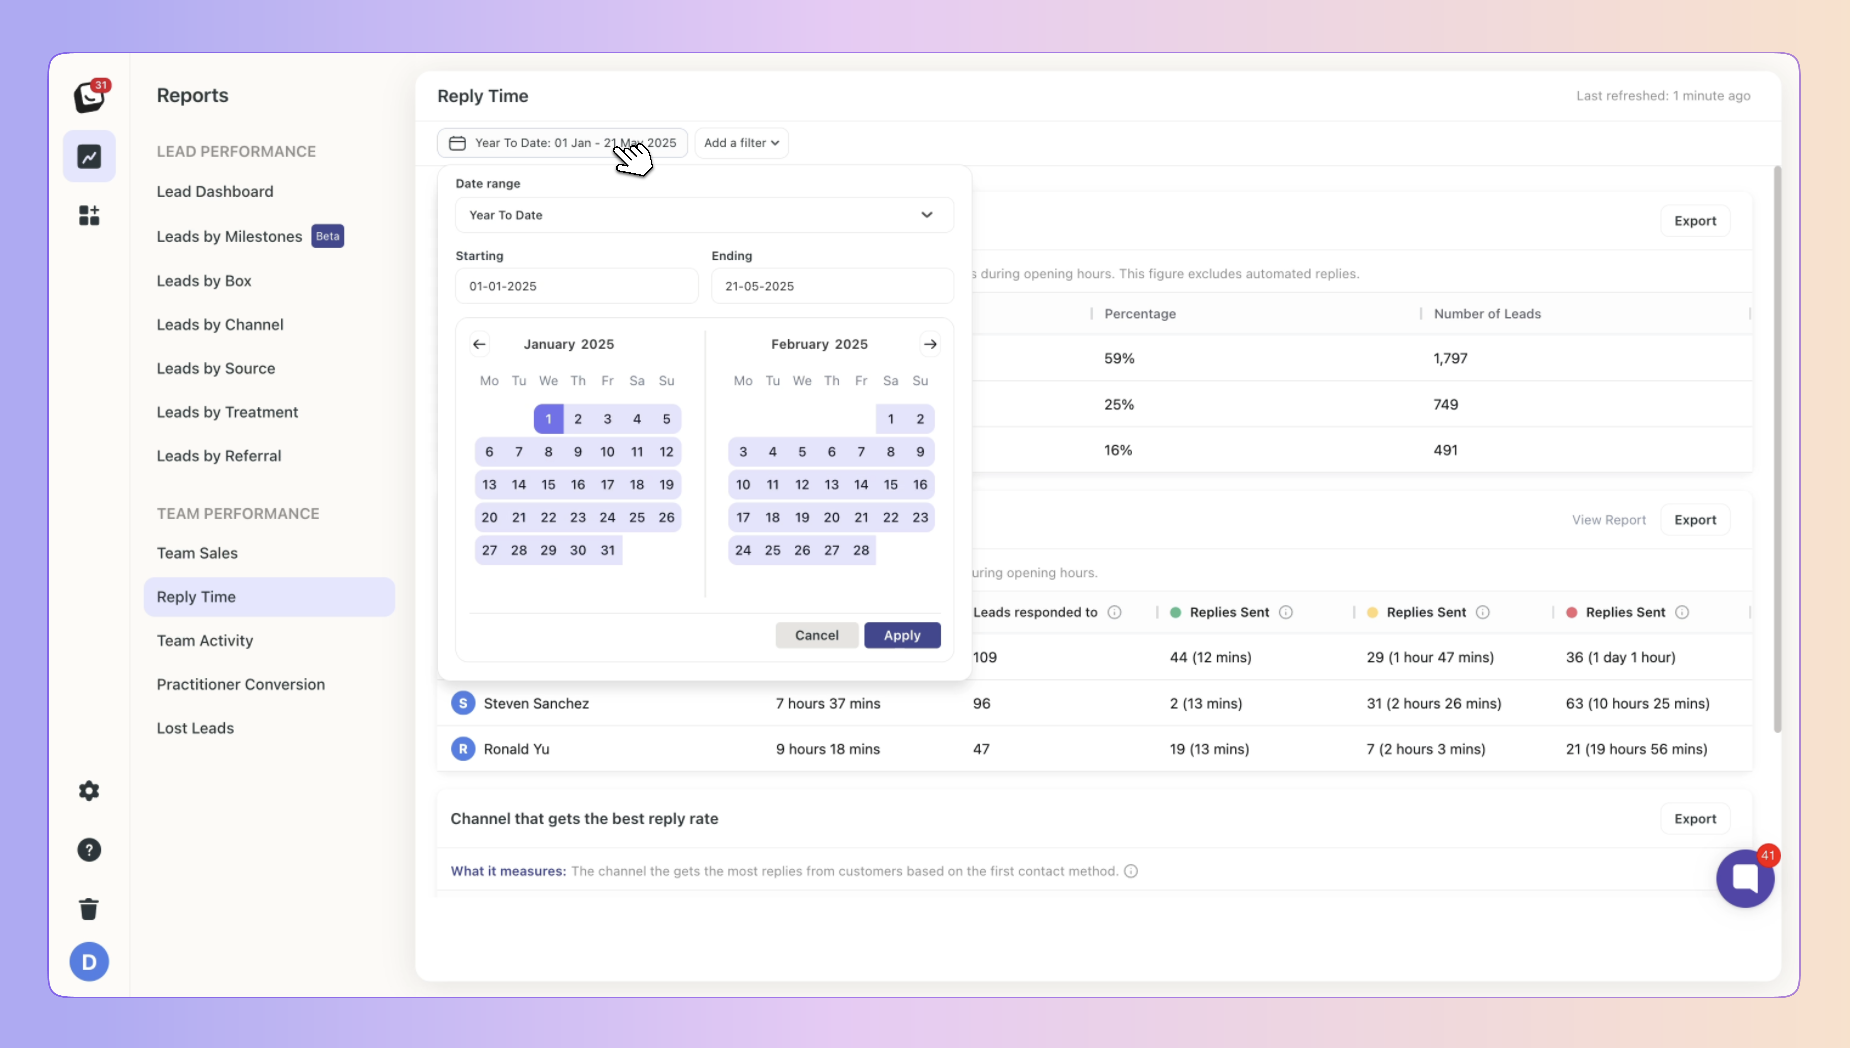
1. Date range -
Options include: Today, Yesterday, Last 7 Days, Last 30 Days, Last 90 Days, Month To Date, Week To Date, Quarter To Date, Year To Date, Last Week, Last Month, Last 3 Months, Last 6 Months, and All Time
2. Starting - Choose a date
3. Ending - Choose a date
✅ Click the “Apply” button
✅ You export the Speed of reply to new leads report, the Who’s responding to leads the fastest (during opening hours) report, and the Channel that gets the best reply rate report separately.
Click on the “Export” button on the right of each report, select the format you wish to export to export your Time reports.
You can export into .csv & .xlsx formats
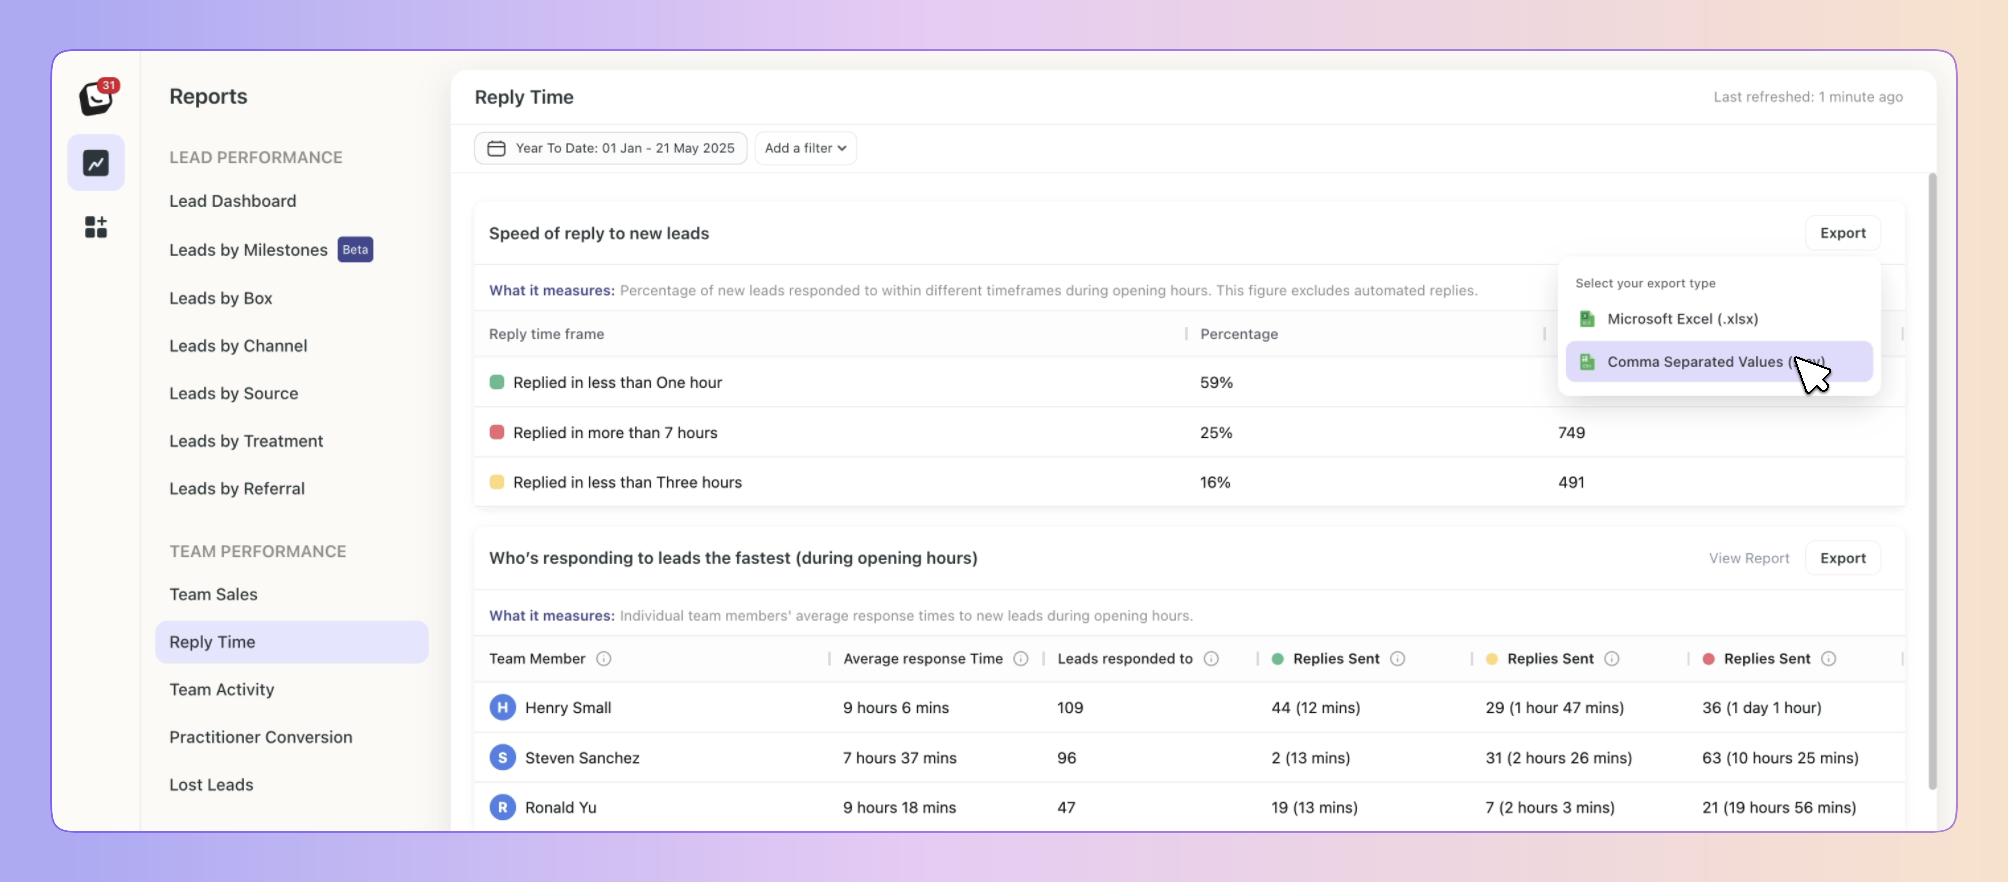
If any filters are active, your exported report will only reflect the data you’ve chosen.

Boxly is here to help you work smarter, not harder, let’s keep streamlining your lead management together!
Contact us at [email protected] if you need any assistance!