✅ Click on the Reporting icon in your left toolbar
✅ In the dropdown list of reports you’ll see on the left, click into the Practitioner Conversion Report to explore.
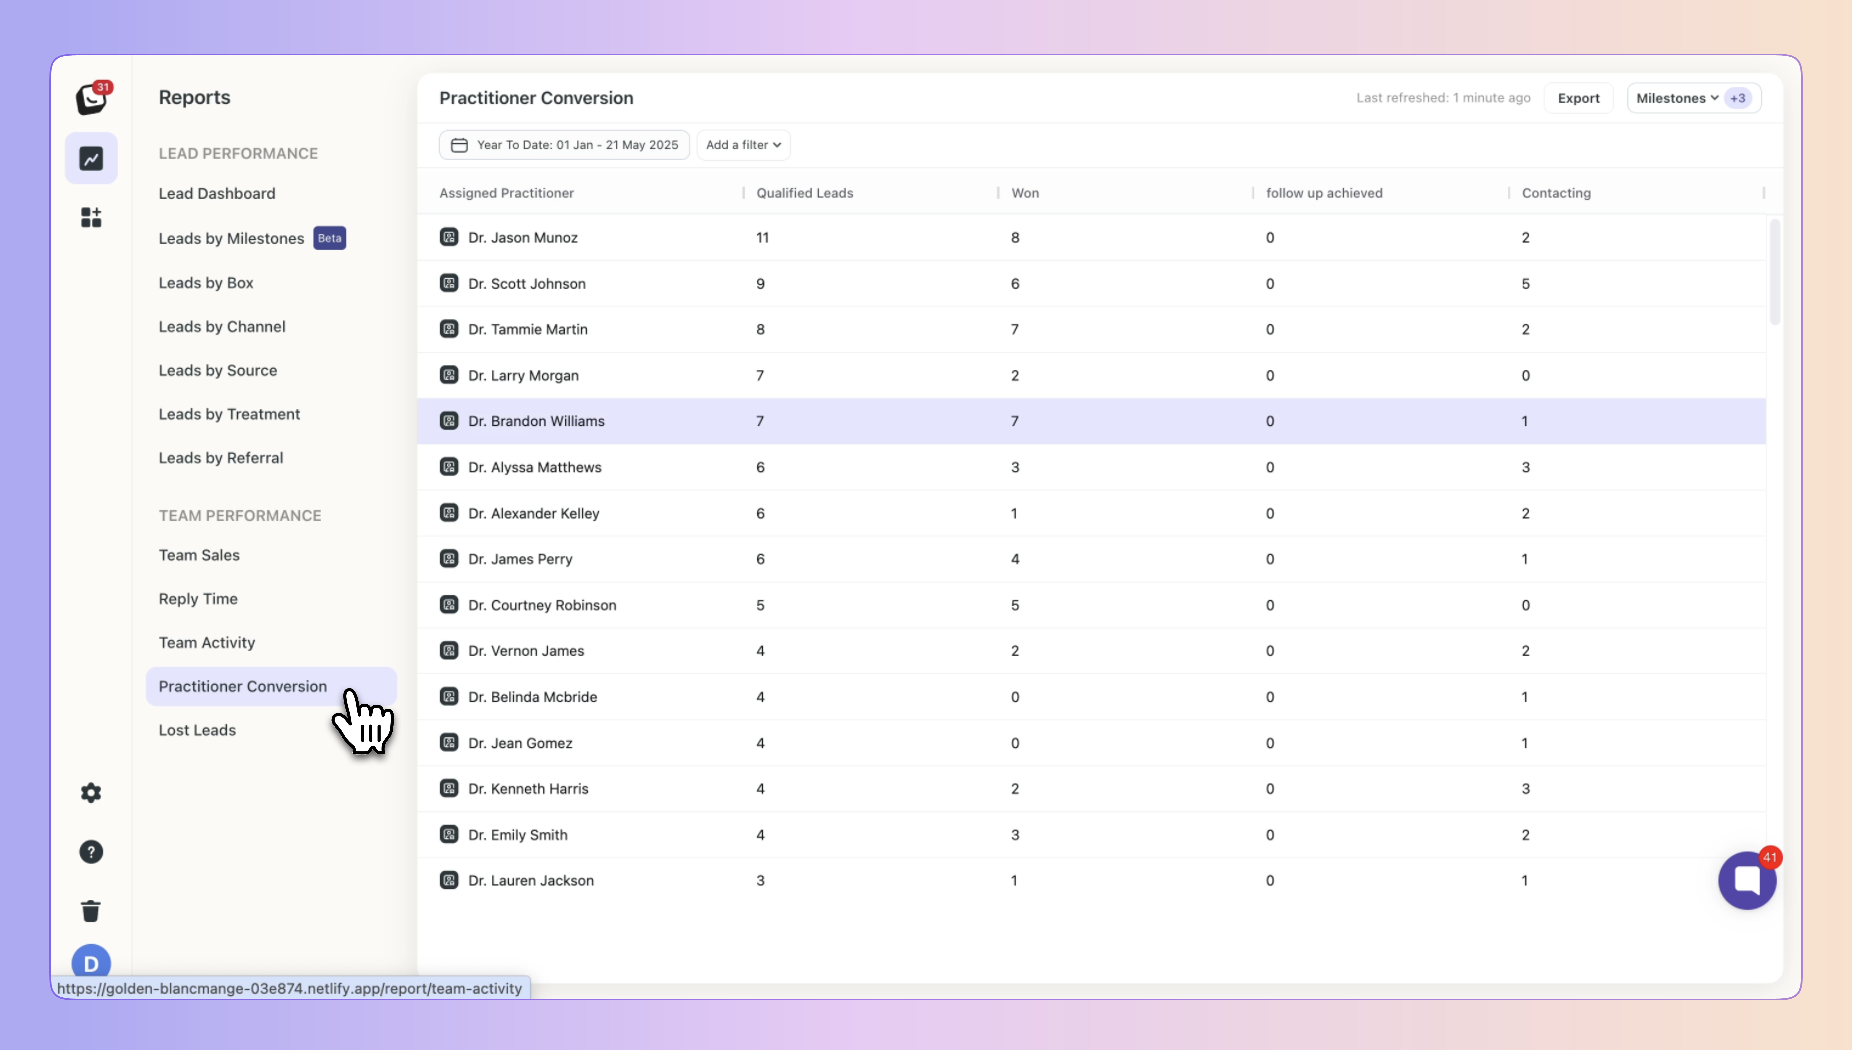
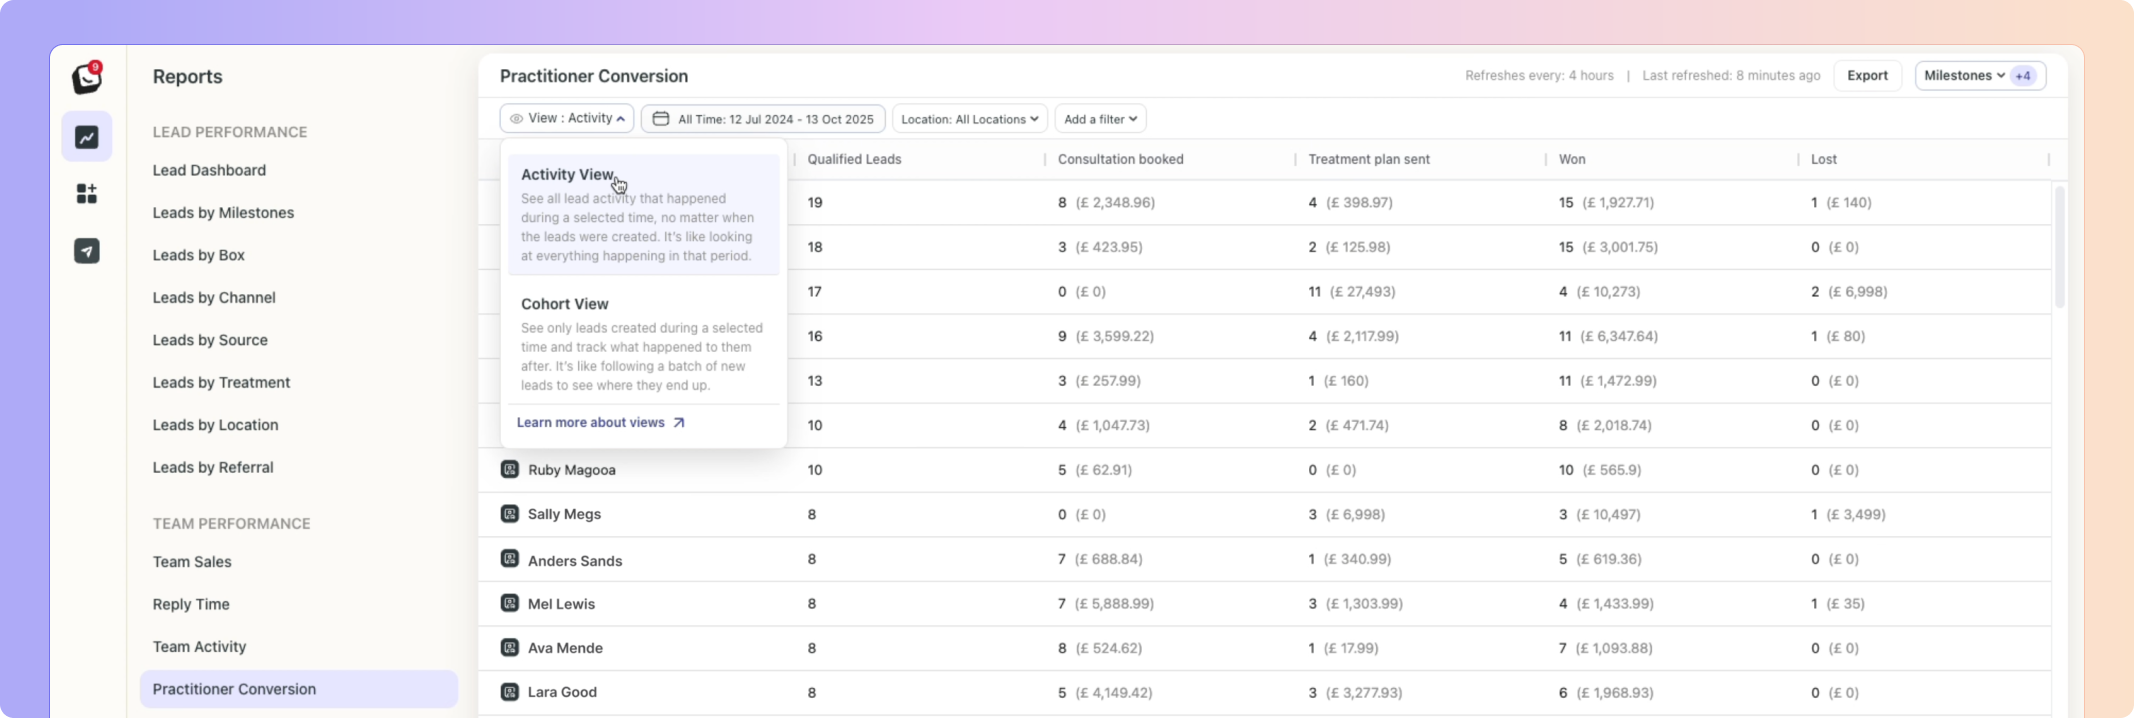
This report shows conversion performance for all practitioners, listing them along with their assigned leads.
You can select milestones to see how practitioners' leads progress through your stages, allowing for comparison of practitioner performance across different stages.
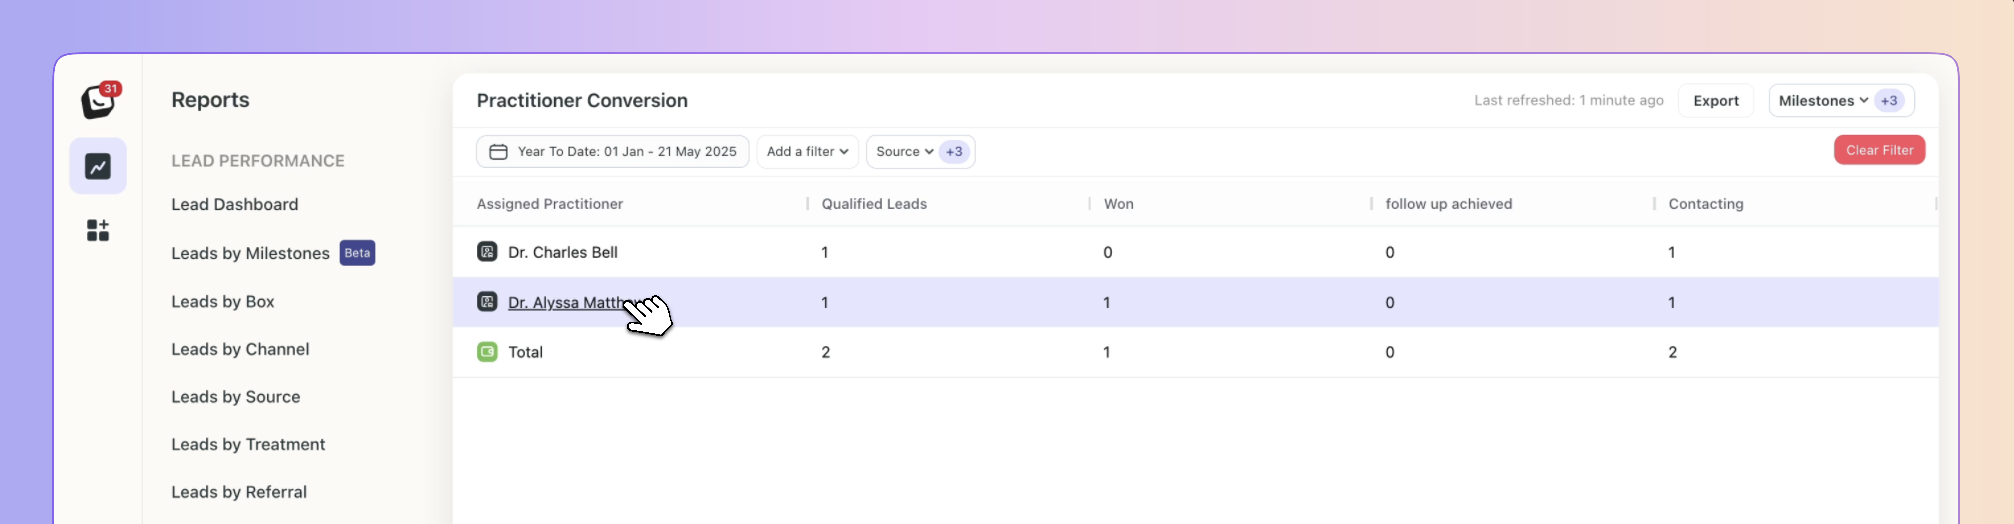
✨ You can click further into your report by clicking on the Practitioner’s name.
Milestones are a flexible way to track all the meaningful moments that happen in your pipeline, they are the key checkpoints in your sales journey that help you measure lead progression.
They’re tied to your Boxly Stages, so as leads move through your pipeline, Boxly automatically tracks when they pass each milestone.
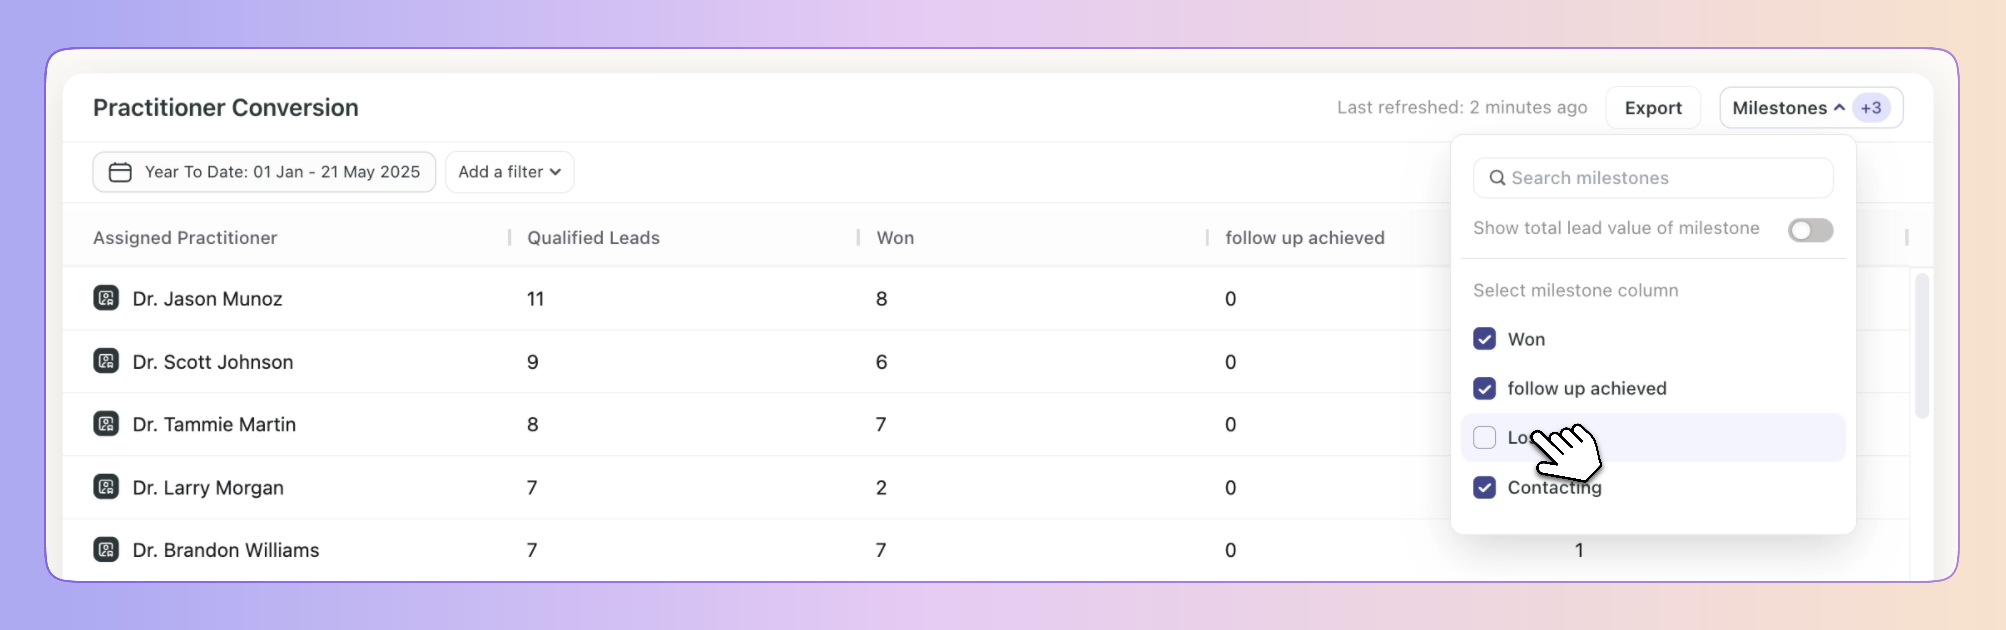
If you want to add the values of the milestones as columns to your view, simply click on the top “Milestones” button and select the milestone you want to display.
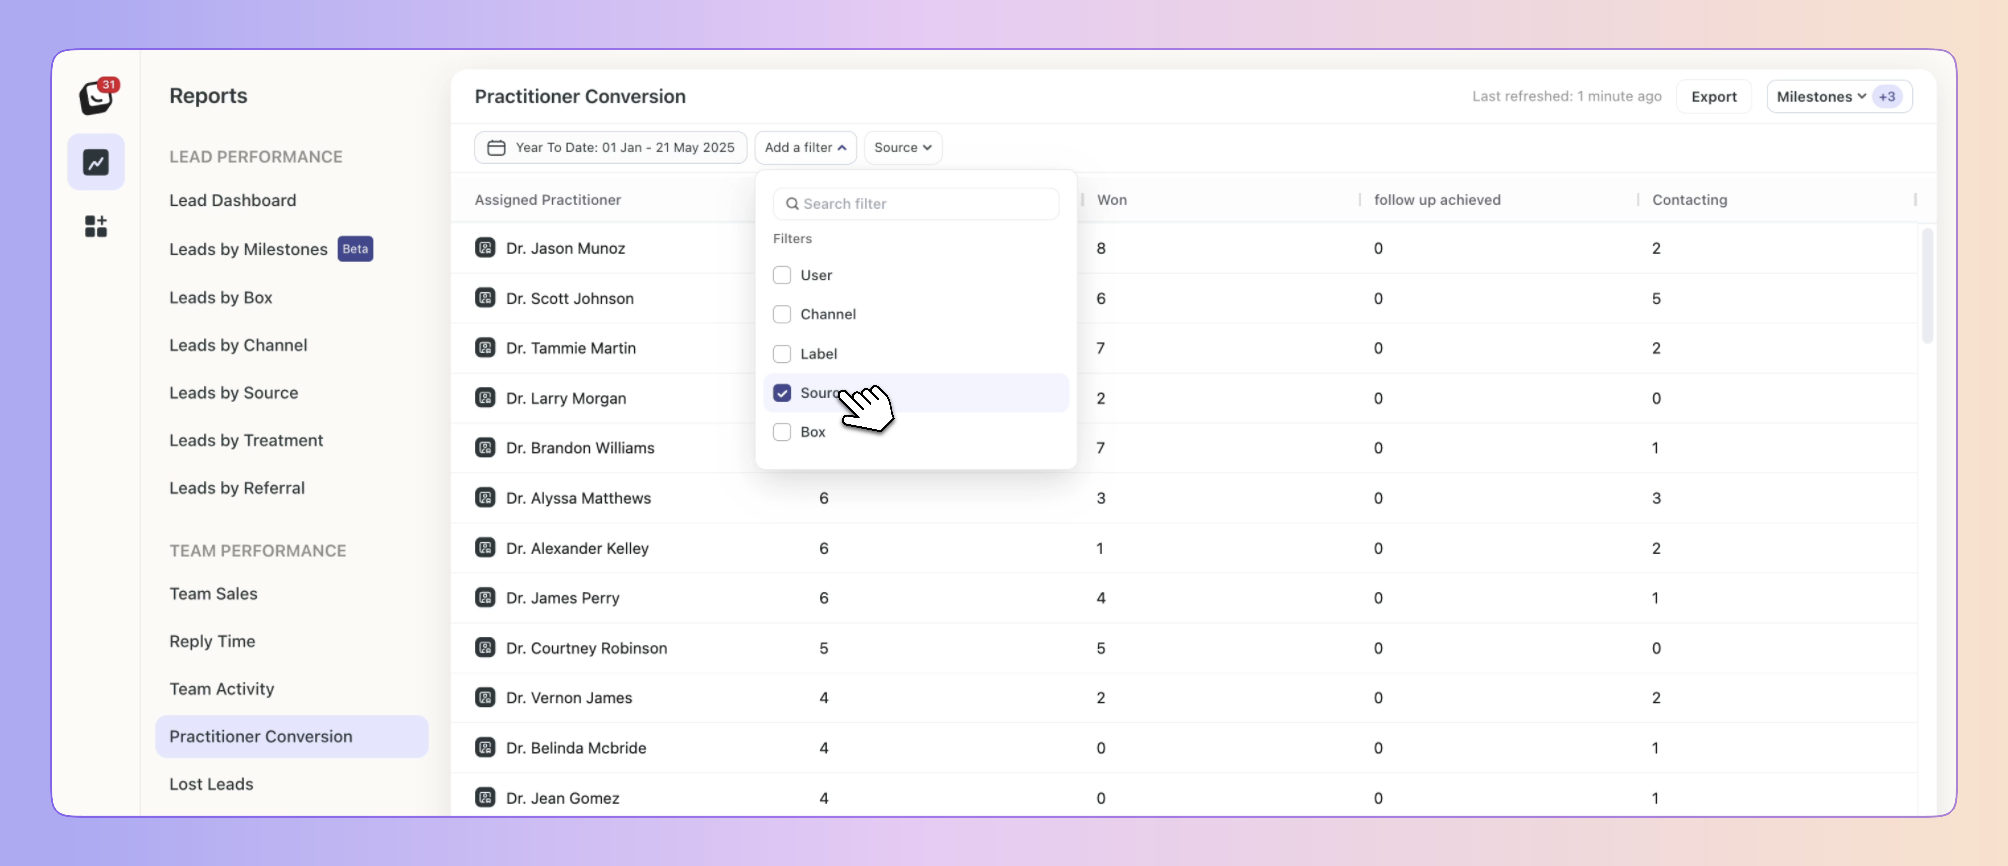
✅ Available filters include: Lead source, Box, Channel, and Label.
✅ Click on “Add Filter”
✅ Select the filter you want applied, like Sources
✅ The Filter’s options will appear next to “Add Filter”, select the specific filter within the category you chose. You can choose as many as you want.
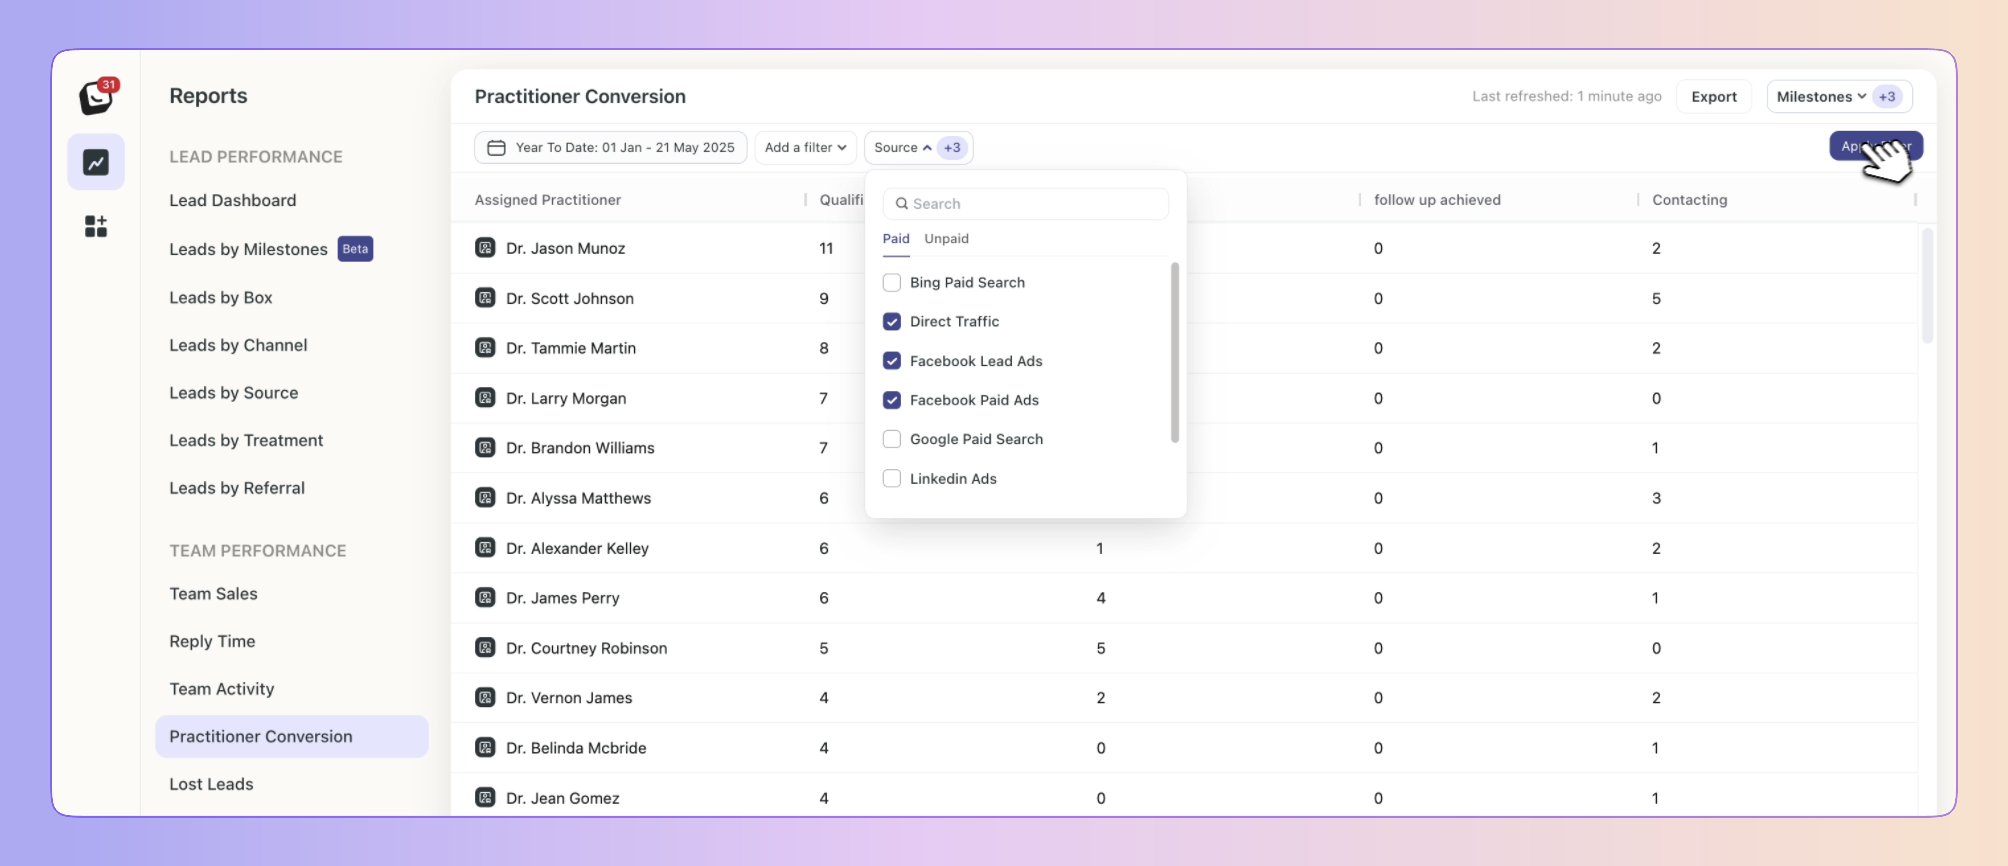
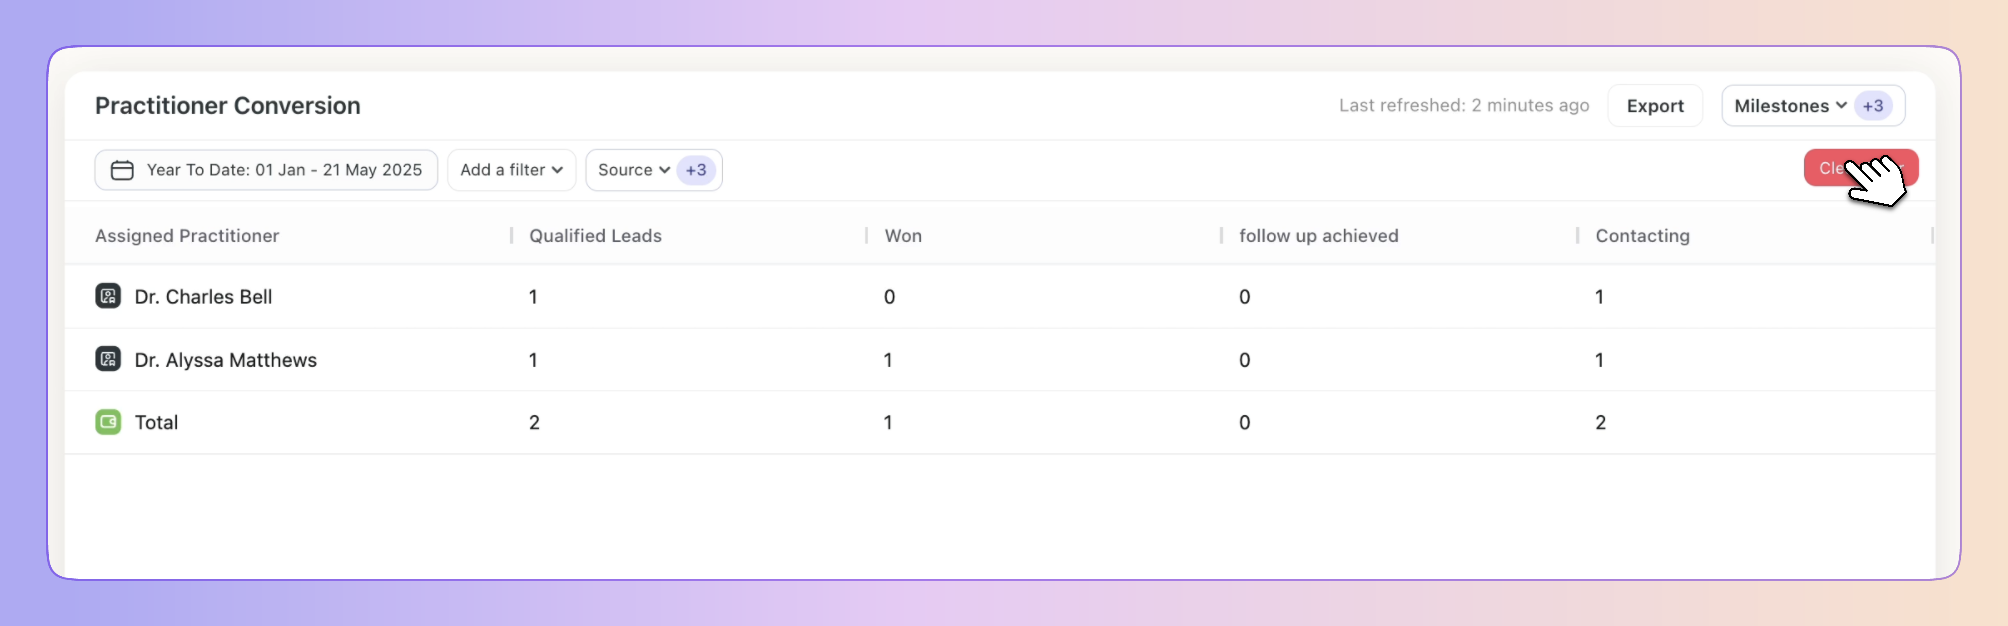
✅ Click “Apply Filter” button on the right and your filter will apply to your report, when you’re done simply click on the red “Clear Filter” button that appears once you’re in a filtered view.
✅ Click on “Date: Last 3 months”, the default time is Year to Date
✅ Select the date you want applied as follows:
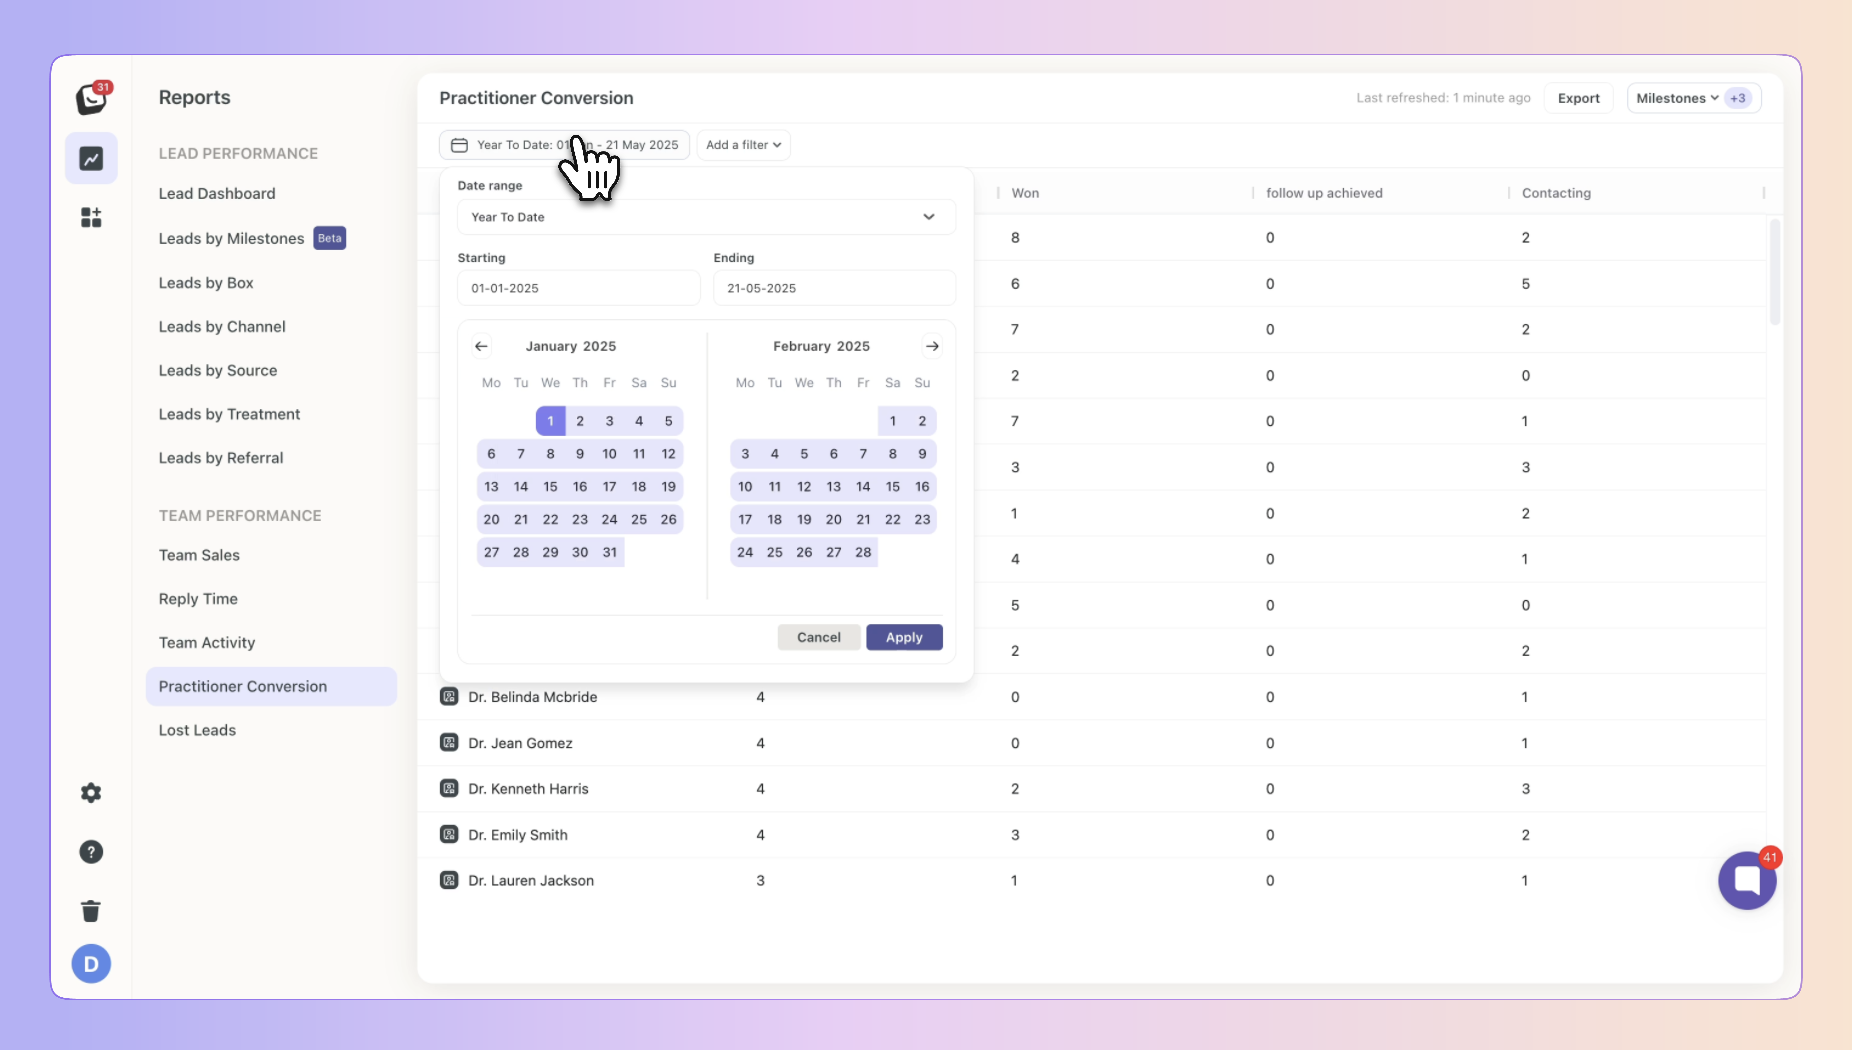
1. Date range -
Options include: Today, Yesterday, Last 7 Days, Last 30 Days, Last 90 Days, Month To Date, Week To Date, Quarter To Date, Year To Date, Last Week, Last Month, Last 3 Months, Last 6 Months, and All Time
2. Starting - Choose a date
3. Ending - Choose a date
✅ Click the “Apply” button
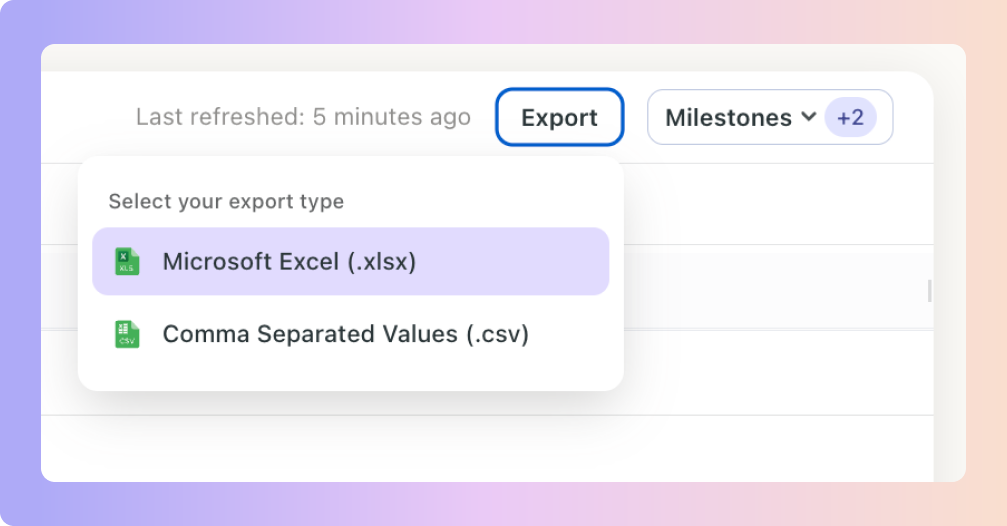
✅ Click on the top Export button to export your Practitioner Conversion Report.
If any filters are active, your exported report will only reflect the data you’ve chosen.
Your Practitioner Conversion Report will be filtered by the filters you’ve chosen.
You can export into .csv & .xlsx formats

Previously, reports only had Cohort View, which showed data for leads created within the selected time period.
🧠 Example:
If a lead came in last month but booked a consultation this week, Activity View will now include it.
You can click the numbers such as “8 consultations booked” to see who those leads are, their current box, and stage.
Boxly is here to help you work smarter, not harder, let’s keep streamlining your lead management together!
Contact us at [email protected] if you need any assistance!