All-in-One Marketing Suite Guide
All-in-One Marketing Suite Inside Boxly Guide
The Ad Spends Report gives you a complete financial view of your marketing performance.
It connects your advertising activity to real conversion outcomes, showing you:
How many leads were generated
How much you spent
How many of those leads converted
How much revenue they produced
What return you achieved on your ad spend
It answers one key question:
“If I spent £X on ads during this period, what did I actually get back?”
This report is designed to help you clearly measure the effectiveness and profitability of your campaigns.
The Ad Spends Report works in Cohort View only.
This means the report:
Looks at leads that were created during the selected date range
Tracks how many of those leads reached a selected milestone
Calculates performance metrics based only on those leads
It does not show where those leads are currently in your pipeline.
Instead, it answers:
“Out of the leads generated during this campaign period, how many converted?”
If you select:
Date range: 17 January – 16 February
Milestone: Consultation Booked
The report will:
Count all qualified leads created between those dates
Show how many of them reached Consultation Booked
Calculate Cost Per Acquisition
Calculate total revenue generated
Calculate Return on Ad Spend

You can refine the report using:
Date range
Location
User
Channel
Label
Practitioner
Box
This allows you to analyse ad performance at location level, practitioner level or campaign level.
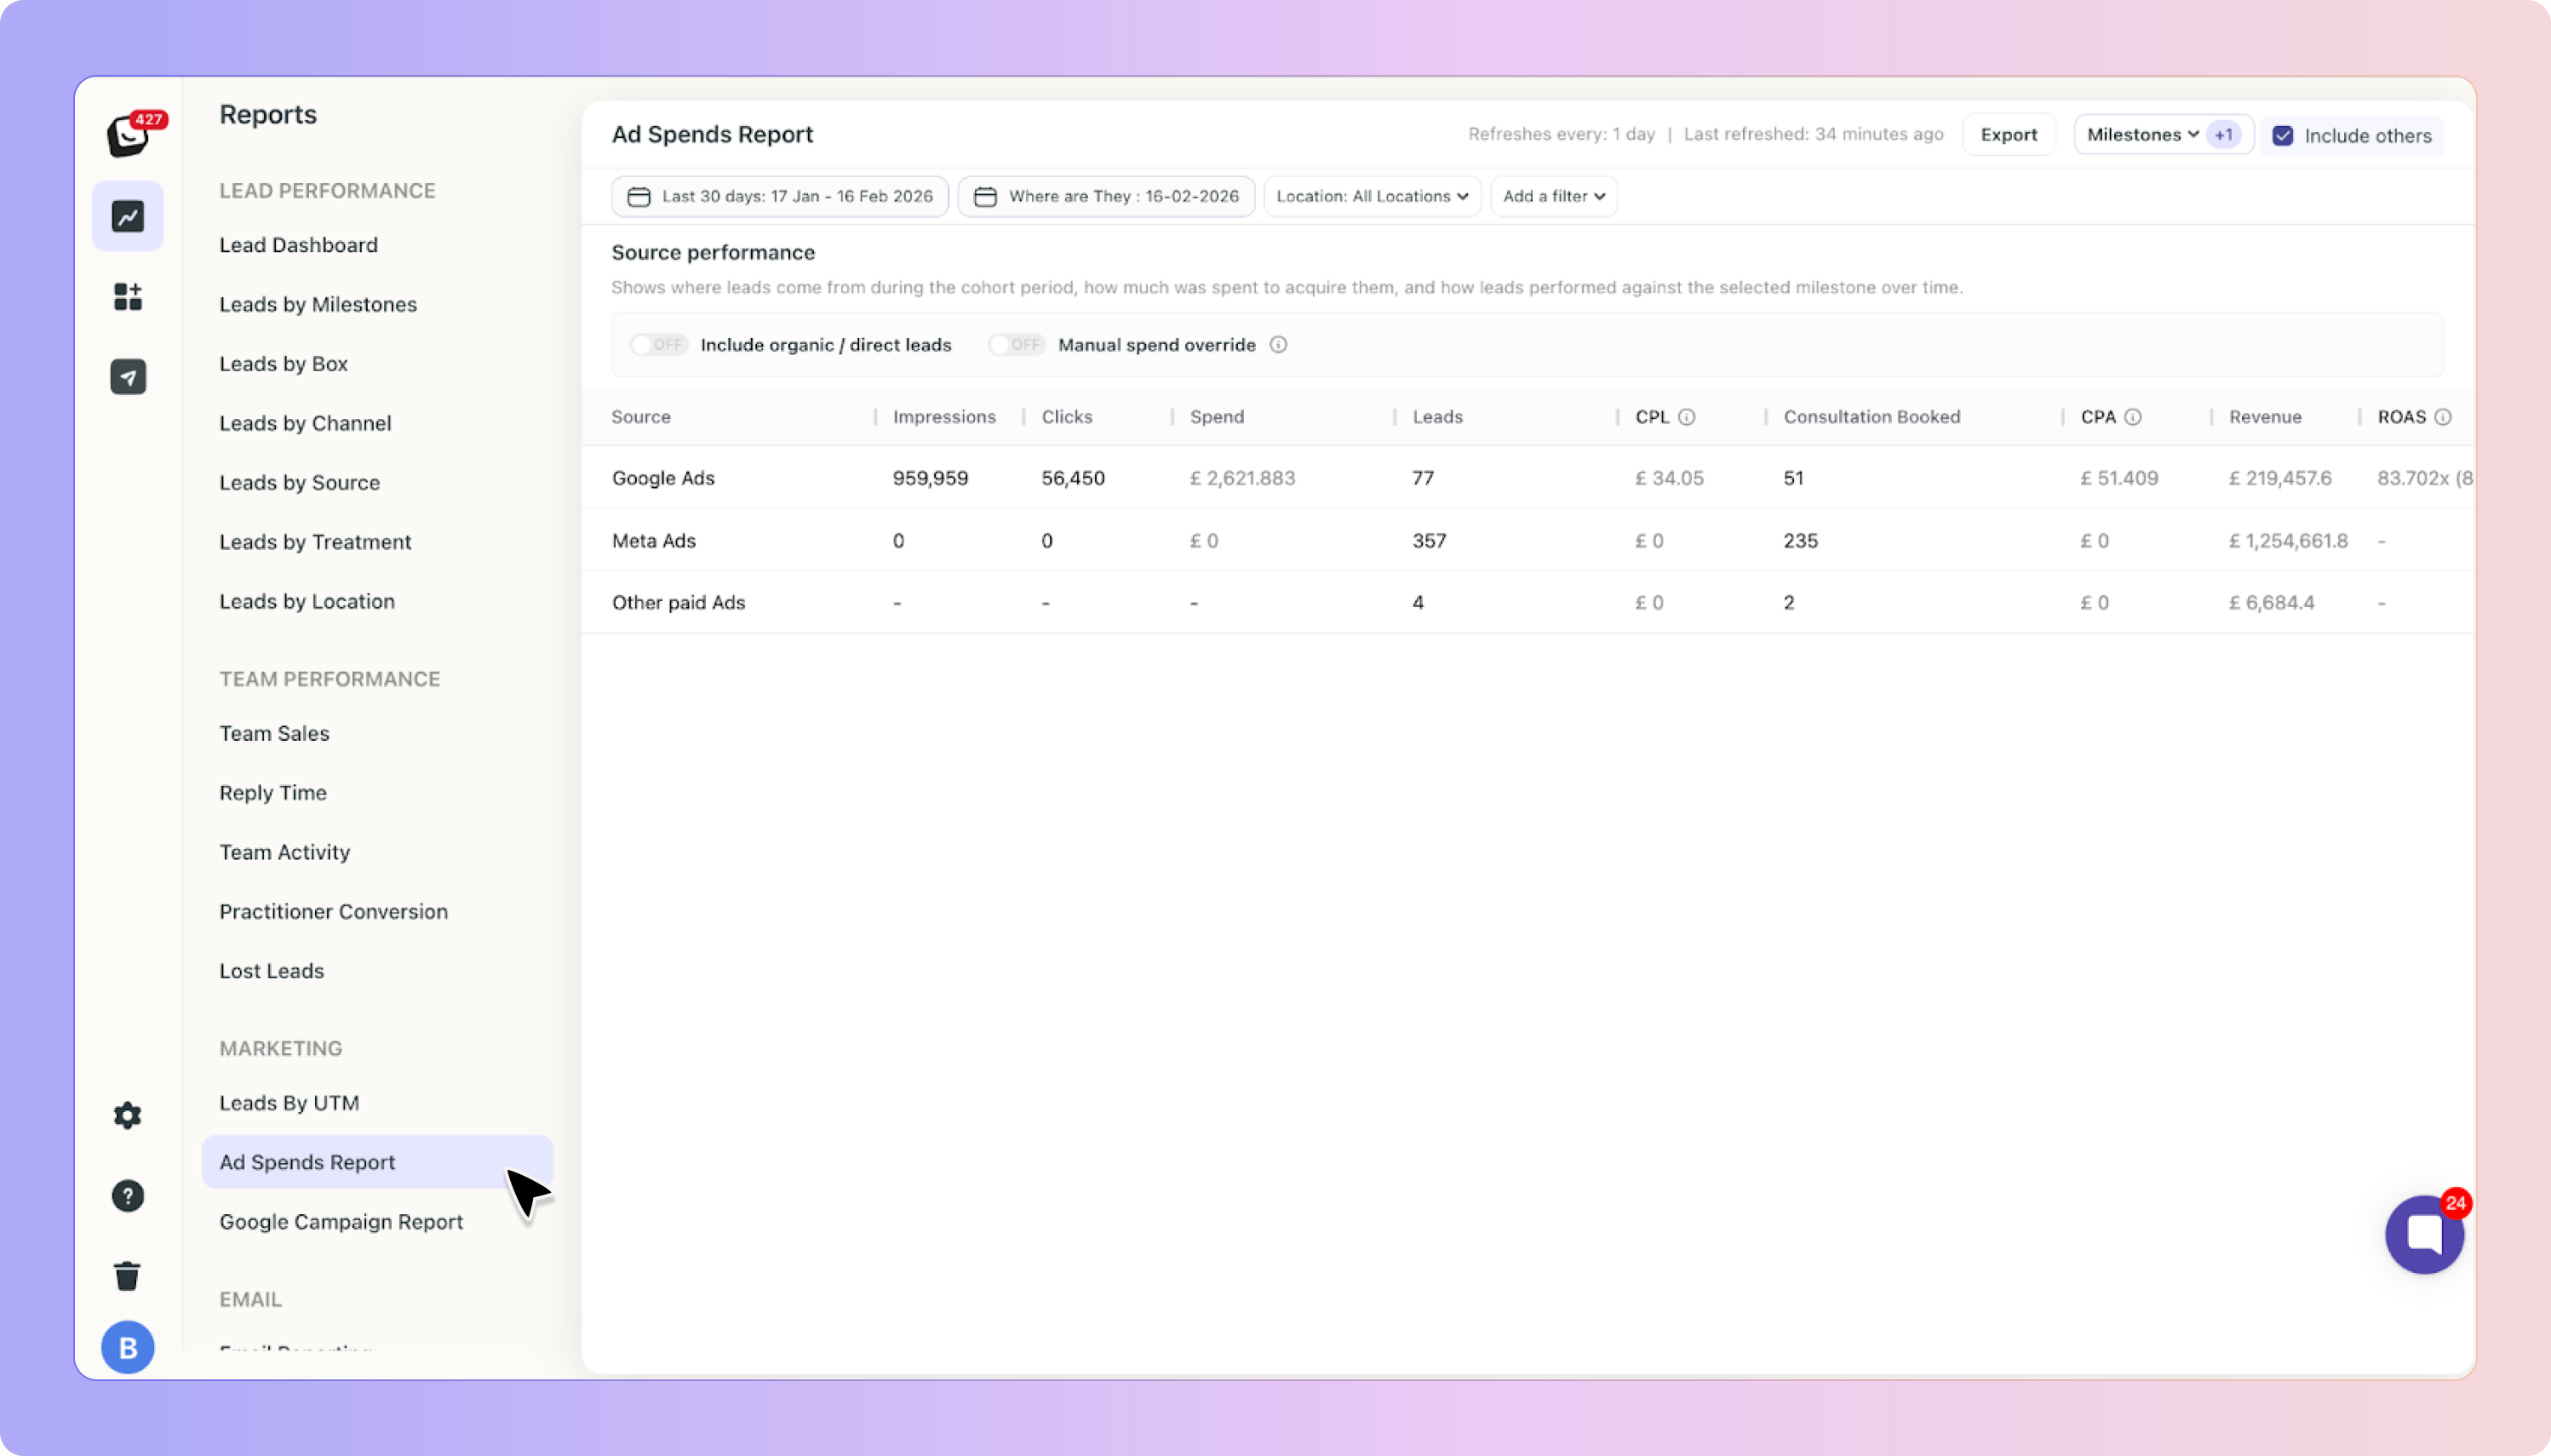
Each row in the report represents a traffic source, such as:
Google Ads
Meta Ads
Other Paid Ads
Organic / Direct
Clicking on the source name (for example, “Google Ads”) will open the list of leads generated from that source during the selected date range.
The individual numbers inside the table are not clickable, only the source name links to the underlying leads.
Below is a detailed explanation of each column.
The acquisition channel that generated the leads.
Clicking the source name opens the filtered list of leads created during the selected period from that source.
The total number of times your ads were shown during the selected date range.
This data is pulled automatically from connected advertising platforms where available.
The number of times users clicked on your ads during the selected period.
This shows how many people interacted with your campaigns.
The total advertising spend for that source during the selected date range.
✨ Google Ads spend is pulled automatically if your Google Ads account is connected.
✨ Meta Ads spend is currently not automatically available.
✨ Other Paid Ads spend must be entered manually.Spend always reflects the exact date range selected at the top of the report.
The number of qualified leads created from that source during the selected period.
Qualified leads exclude spam, bin and “other” leads, following the same reporting logic used across the platform.
CPL stands for Cost Per Lead.
It shows how much you paid to acquire each qualified lead.
It is calculated as:
Total Spend ÷ Number of Qualified LeadsFor example, if you spent £2,000 and generated 50 qualified leads:
£2,000 ÷ 50 = £40 CPL
At the top right of the report, you will see a Milestones dropdown.
You can select one milestone at a time.
The selected milestone determines which conversion stage is measured in the table.
For example:
✨ If you select Consultation Booked, the table will show how many leads from each source reached Consultation Booked.
✨ If you select Won, it will show how many leads were marked as Won.Only one milestone can be selected at a time to keep the calculations clear and focused.
CPA stands for Cost Per Acquisition.
It shows how much you paid for each lead that reached the selected milestone.
It is calculated as:
Total Spend ÷ Number of leads that reached the selected milestoneFor example, if you spent £2,000 and 20 leads reached Consultation Booked:
£2,000 ÷ 20 = £100 CPA
Revenue is calculated based on:
✨ The milestone selected
✨ The monetary value assigned to that milestone in your settingsFor example, if Consultation Booked has a value of £150 and 20 leads reached that milestone:
20 × £150 = £3,000 RevenueIf milestone values are not configured correctly, revenue figures will not be accurate.
ROAS stands for Return on Ad Spend.
It shows how much revenue was generated for every £1 spent.
It is calculated as:
Revenue ÷ Total SpendFor example:
£3,000 revenue ÷ £1,000 spend = 3x ROASA ROAS of 3x means that for every £1 spent, £3 was generated in revenue.
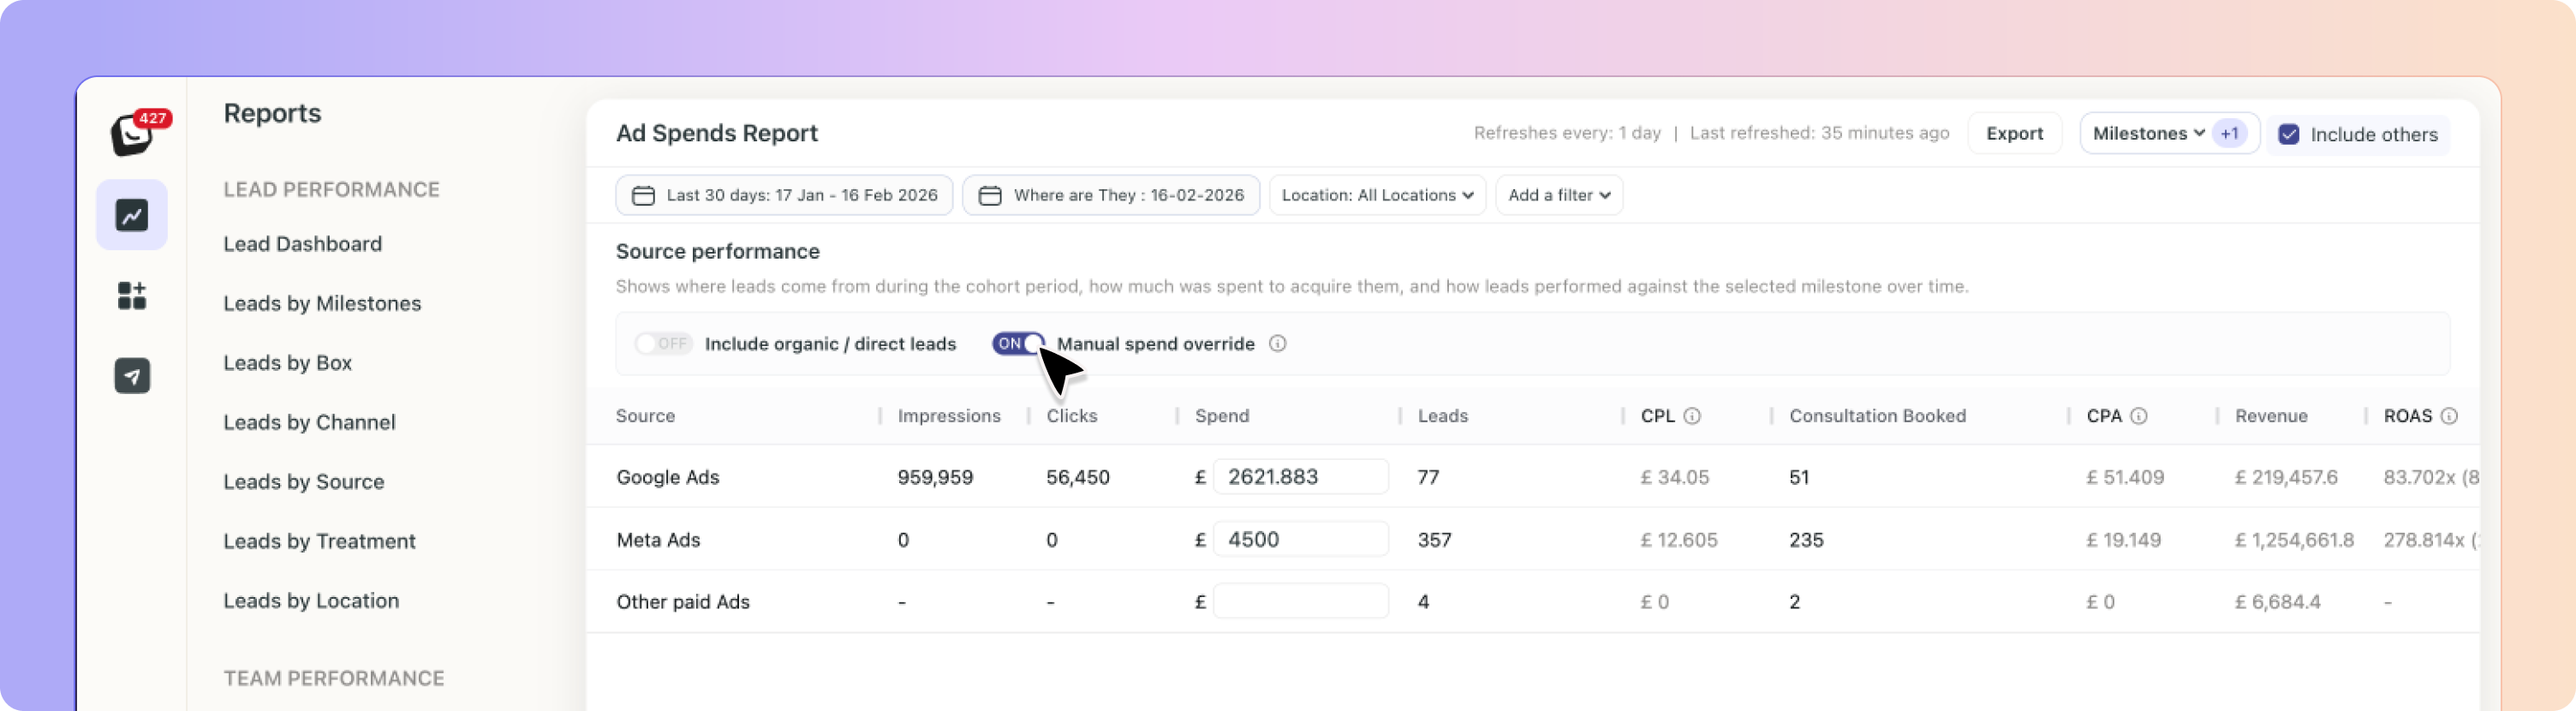
At the top of the report, you will see a toggle for Manual Spend Override.
By default, this toggle is OFF.
When it is OFF:
Google Ads spend will populate automatically (if connected).
Meta Ads spend will remain empty.
Other Paid Ads spend will remain empty.
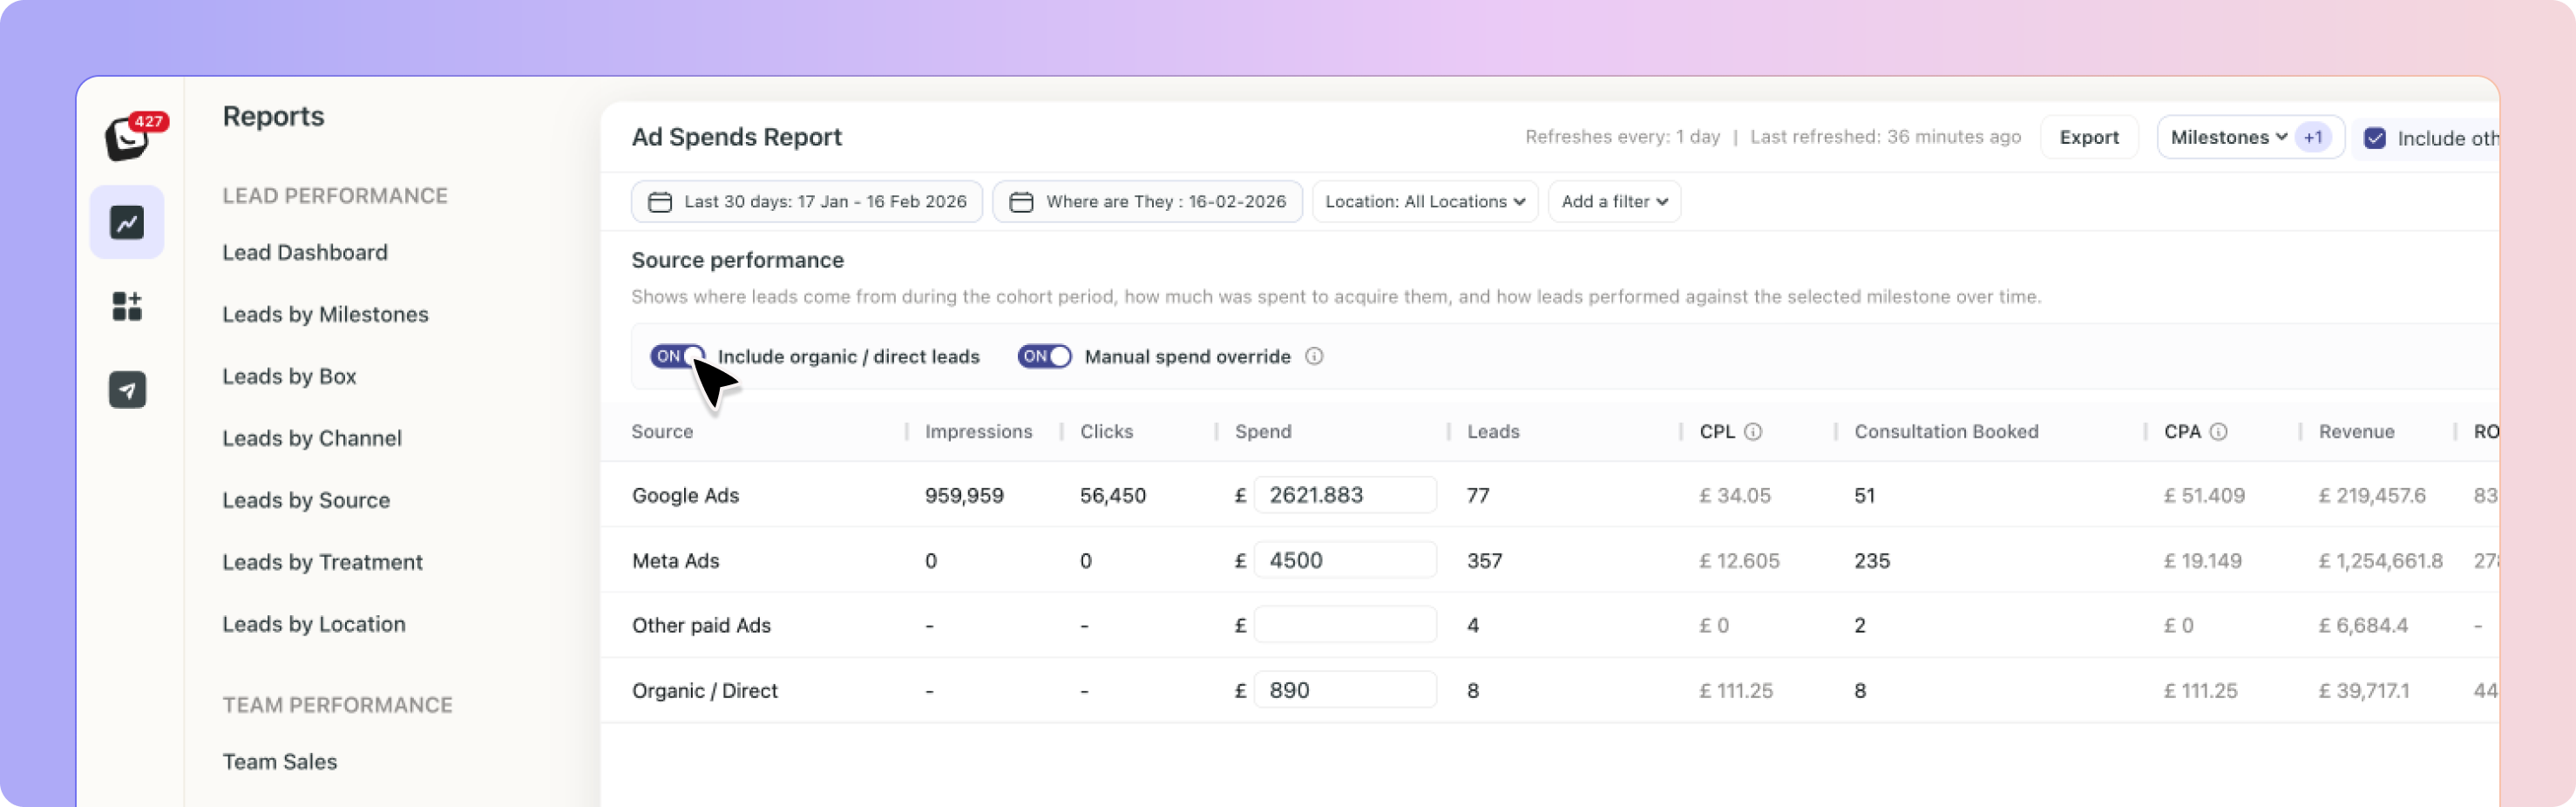
When you turn it ON:
You can manually enter spend for:
Google Ads
Meta Ads
Other Paid Ads
Organic / Direct
As soon as you enter a spend value, the report automatically recalculates:
CPL (Cost Per Lead)
CPA (Cost Per Acquisition)
ROAS (Return on Ad Spend)
This ensures you can measure performance accurately even if automatic spend data is unavailable.
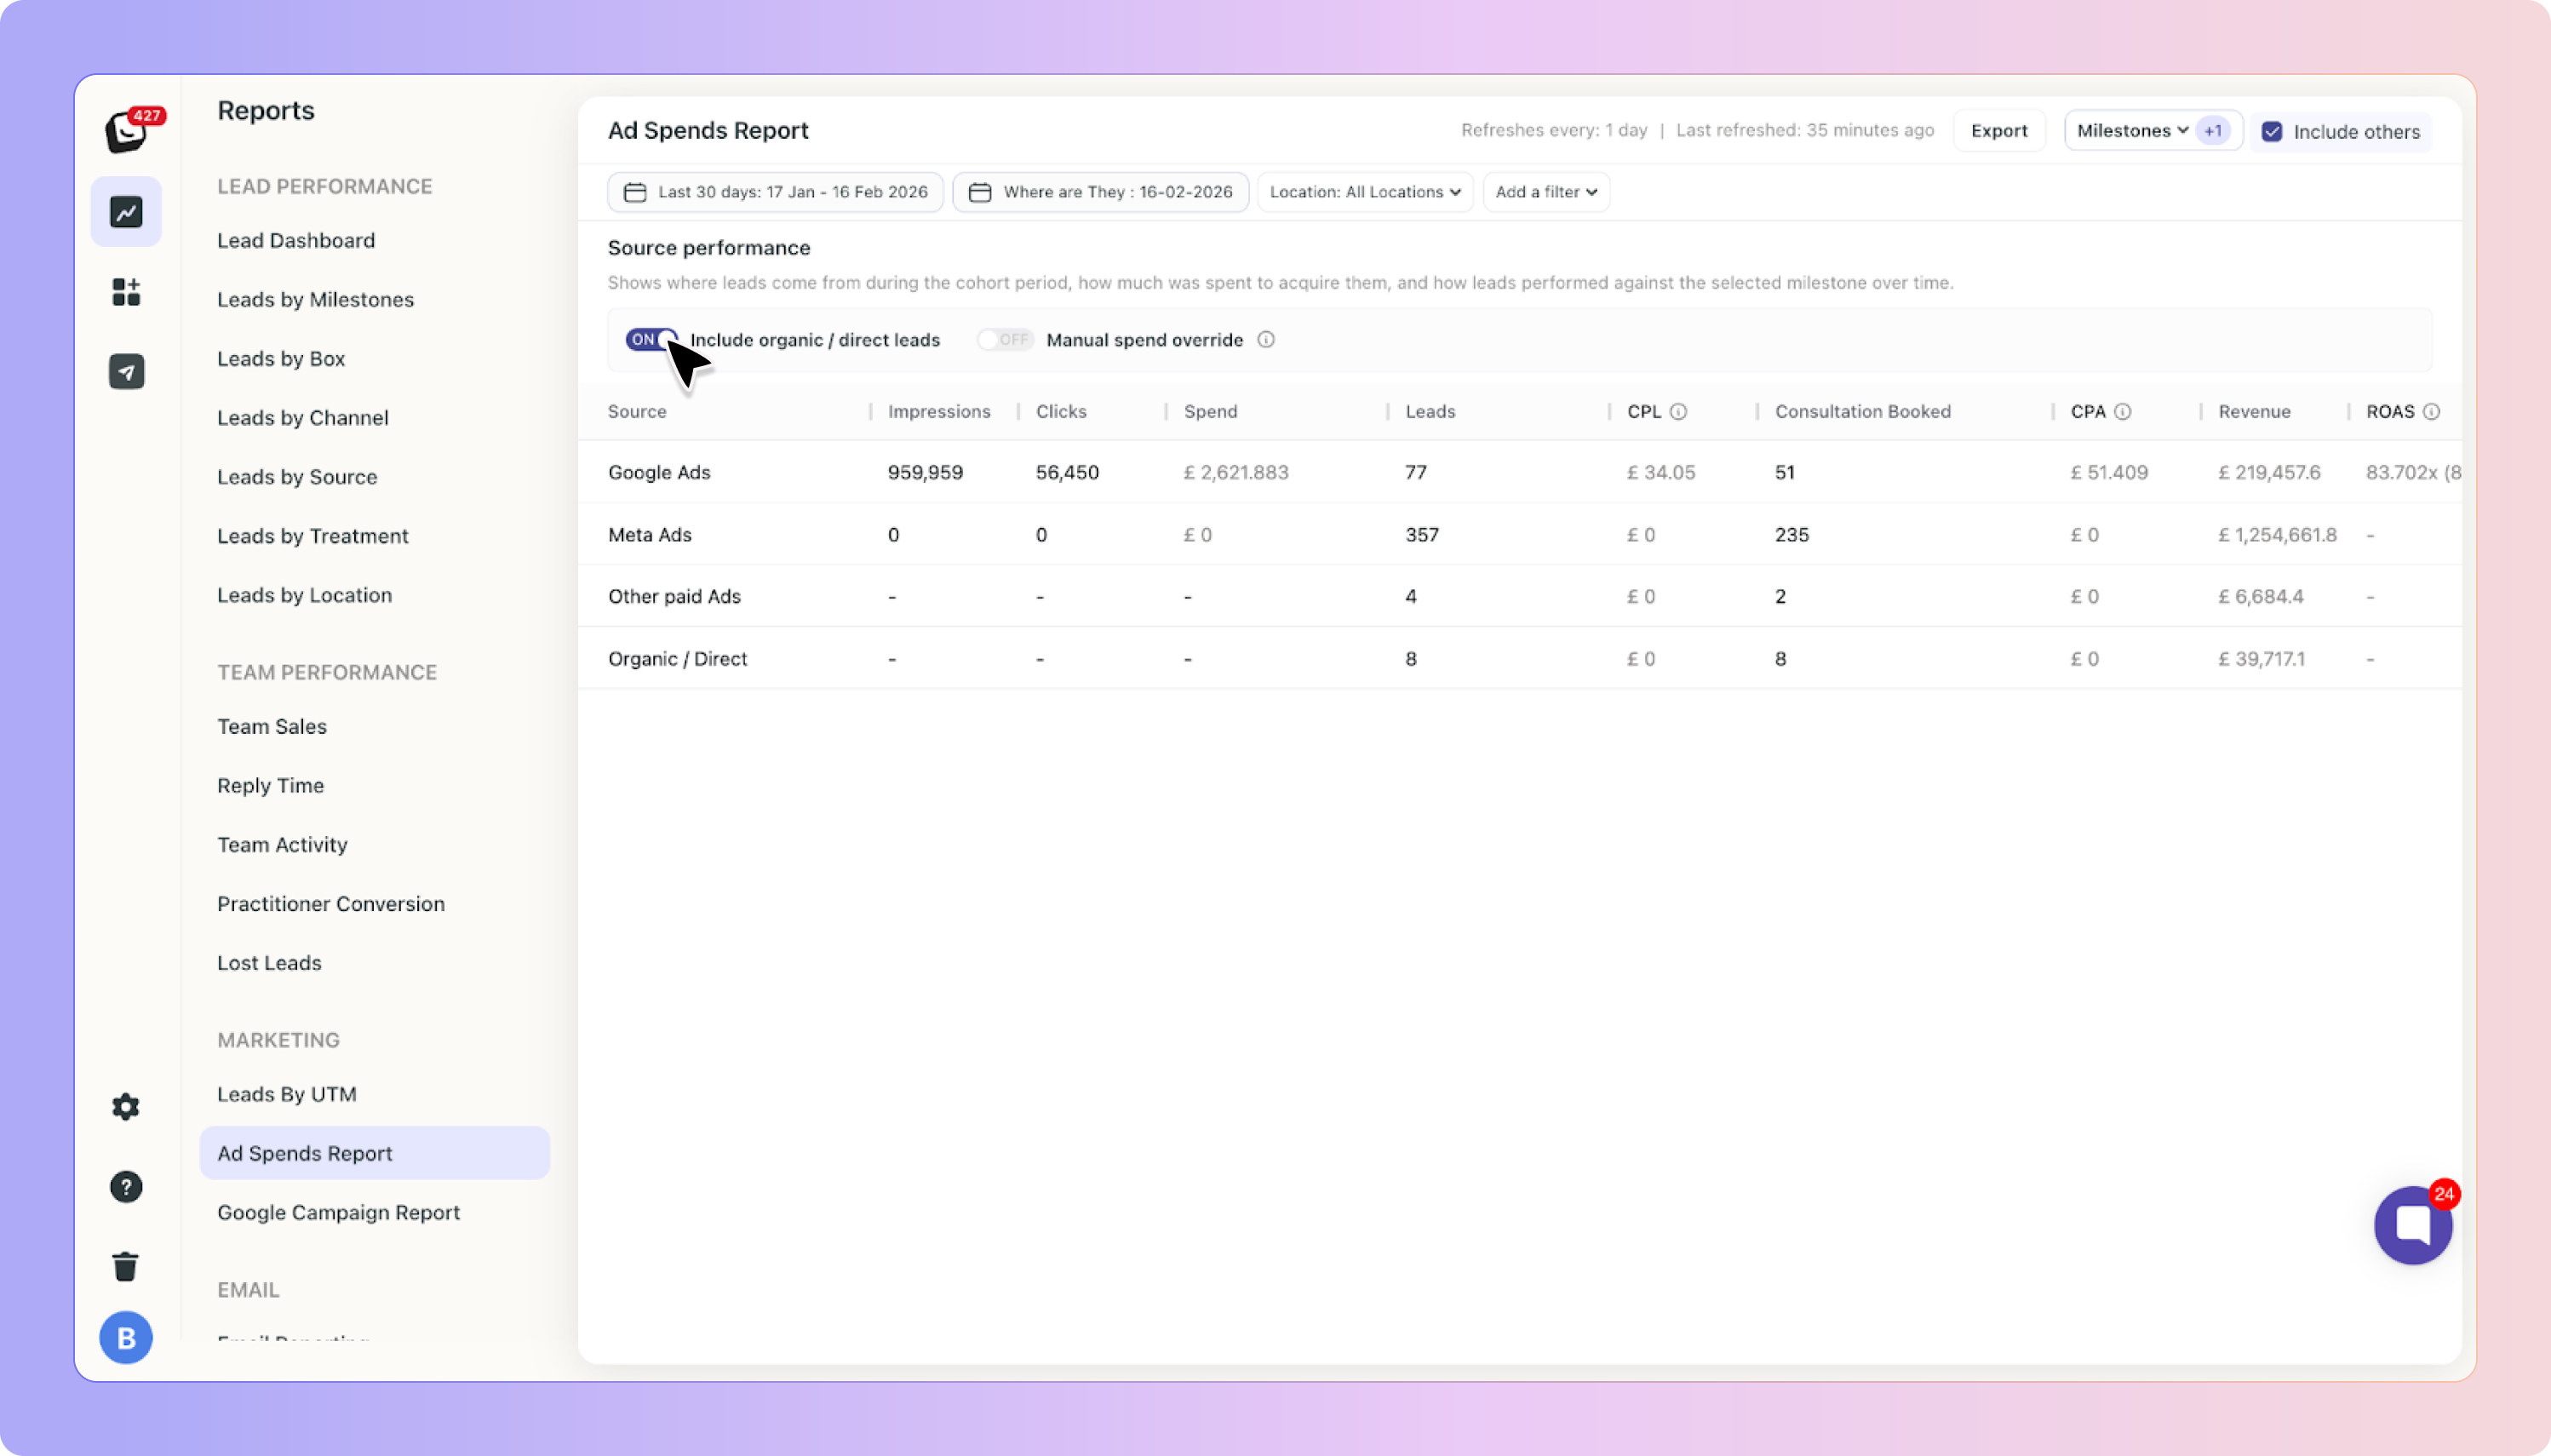
You will also see a toggle for Include Organic / Direct Leads.
By default, this toggle is OFF.
When OFF:
The report focuses purely on paid advertising performance.
When turned ON:
Organic and Direct leads will be included in the table.
You can optionally assign spend to those channels.
You can compare paid and organic performance side by side.
Meta does not currently provide spend data in a format that we can automatically sync into Boxly.
Because of this:
Meta spend is not automatically populated.
Manual entry is required using Manual Spend Override.
The Ad Spends Report refreshes once per day.
The last refresh time is displayed at the top of the report.
To see impressions, clicks and automatic Google Ads spend:
Your Google Ads account must be connected.
Tracking must be correctly configured.
Revenue calculations depend on:
Proper milestone configuration
Accurate milestone values in your settings
Use the Ad Spends Report to understand:
Which advertising channel is most profitable
How much you are paying per consultation
Whether your campaigns are generating positive return
Performance per location or practitioner
The financial impact of your marketing investment
Understanding the Pro Plan: Tracking, Ad Optimisation, and Broadcasts
A quick guide to using Boxly Pro for smarter marketing and lead tracking.
Boxly is here to help you work smarter, not harder! Let’s keep streamlining your lead management together!
Contact us at [email protected] if you need any assistance!