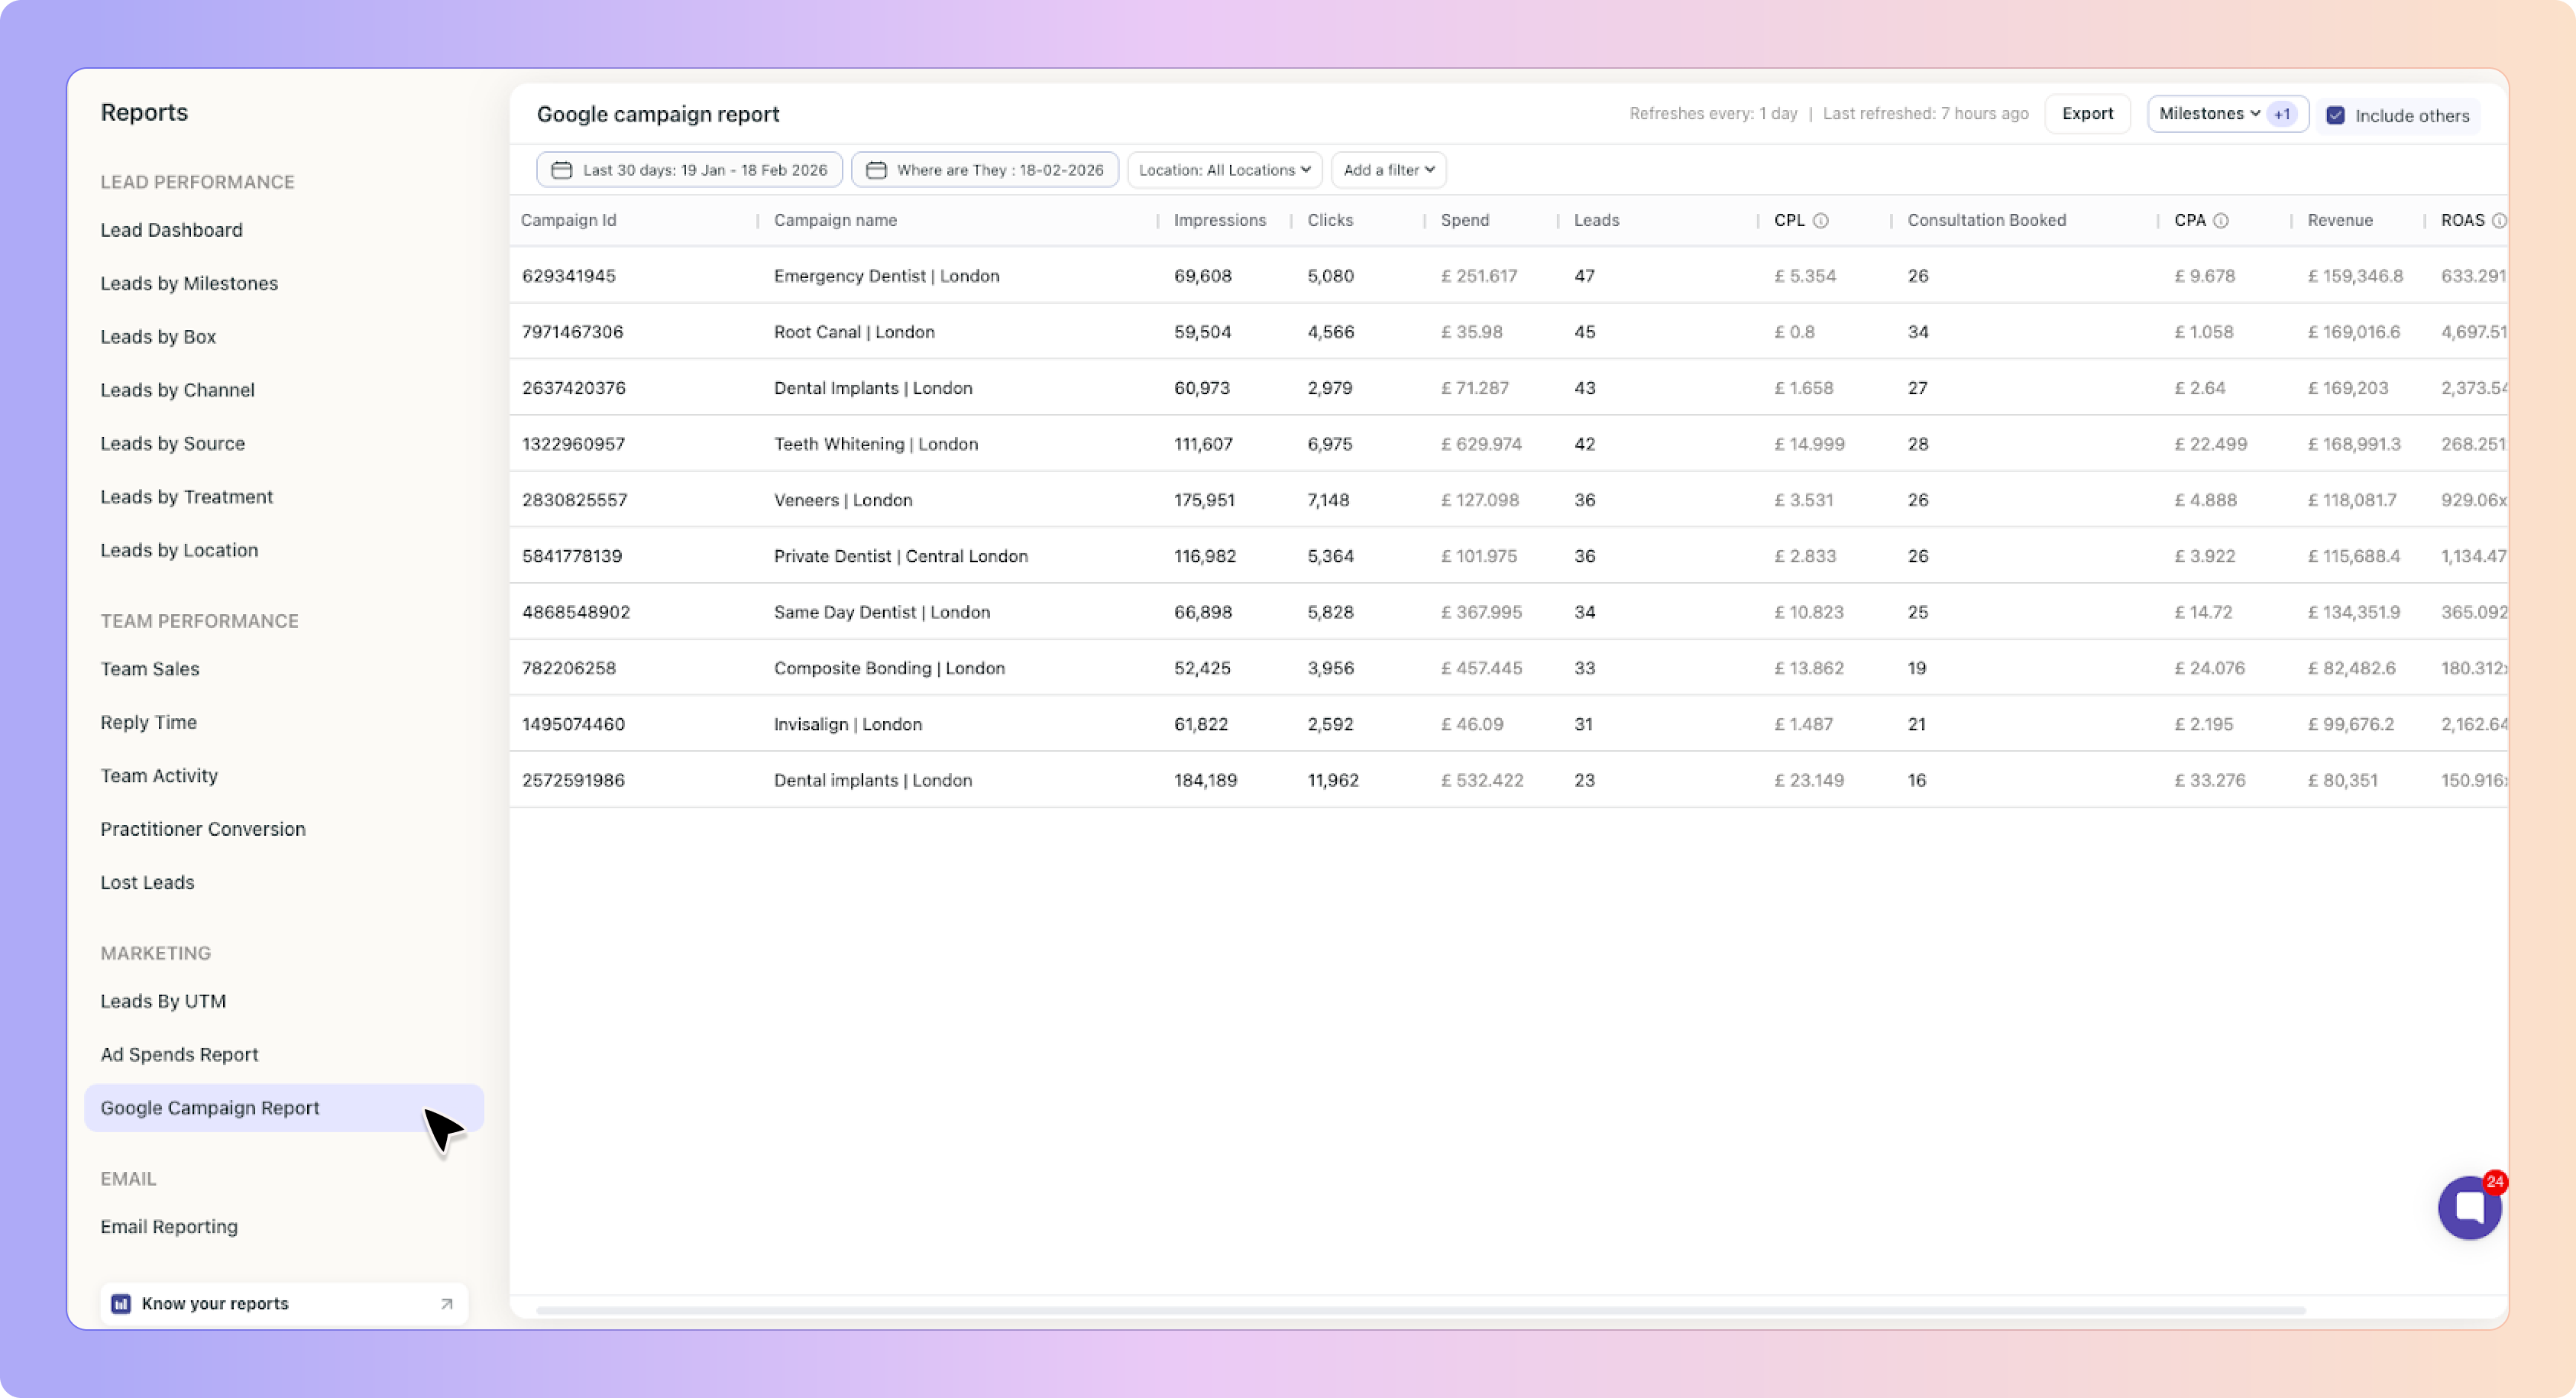
The Google Campaign Report provides a detailed breakdown of every Google Ads campaign connected to your account and shows exactly how each campaign is performing.
Unlike basic ad reporting that only shows clicks and spend, this report connects:
Impressions → Clicks → Leads → Conversions → Revenue
This allows you to clearly understand:
Which campaigns are generating the most leads
Which campaigns are generating real revenue
Which campaigns are too expensive
Where your marketing budget should be scaled or reduced
Each row in the table represents a single Google Ads campaign.
Go to the Google campaign report
All data in the report updates based on the filters selected at the top of the page.
Controls:
Impressions
Clicks
Spend
Leads created within the selected period
Milestone progression (depending on the selected view)

✨ This is used when analysing milestone progression in relation to a specific date.
It allows you to see where leads generated during a selected period currently sit in your pipeline.
✨ This filters campaigns and leads by location.
You can filter the report by:
User
Box
Label
Lead Source
Channel
✨ This allows deeper segmentation of campaign performance.
By default, the report displays Leads only.
When you click Milestones, you can select one conversion milestone at a time, such as:
Consultation Booked
Treatment Started
Treatment Finished
Any custom revenue milestone
Once selected:
A new column is added for that milestone
CPA (Cost Per Acquisition) is calculated
Revenue is calculated (if values exist)
ROAS updates accordingly

Milestones
Track and report on the journey from lead to customer accurately.
Each row represents one Google Ads campaign.
The unique campaign ID from Google Ads.
✅ This is the only clickable element in the report.
Clicking the Campaign ID opens a list view showing all leads attributed to that specific campaign.
This allows you to:
View the actual leads
Audit attribution
Verify milestone progression
Check assigned values
The exact name of the campaign from Google Ads.
This is for identification only and is not clickable.
The total number of times the ads in that campaign were shown during the selected date range.
✨ Pulled directly from Google Ads.
The total number of times users clicked on ads within that campaign during the selected period.
The total amount spent on that campaign during the selected date range.
✨ Spend data is pulled directly from Google Ads.
The total number of leads generated from that campaign.
A lead is attributed when:
A user clicks your Google ad
The gclid is captured
A webform or chatbot submission is made
Boxly correctly attributes the lead to the campaign
Calculated as:
Spend ÷ Leads
This shows the average cost to generate one lead from that campaign.
Visible once a milestone is selected.
Calculated as:
Spend ÷ Number of leads that reached the selected milestone
Example:
Spend: £2,000
20 Consultation Booked
CPA = £100
Revenue is calculated only when:
A milestone is selected
Leads have reached that milestone
Those leads have a monetary value assigned
Revenue depends on:
Milestone values being configured in Settings
Leads progressing into revenue stages
Values being properly assigned to leads
Calculated as:
Revenue ÷ Spend
✨ ROAS shows how much revenue is generated for every £1 spent.
Example:
Spend: £1,000
Revenue: £5,000
ROAS = 5.0 (5x return)
Only the Campaign ID is clickable.
When clicked:
You are taken to a filtered list view
You see the exact leads attributed to that campaign
The list follows the same structure as the main Leads view
This makes the report fully auditable and transparent.
You may see blank values if:
No milestone is selected
No leads reached the selected milestone
Leads reached the milestone but do not have a value
Milestone values are not configured in Settings
Google Ads is not properly connected
Revenue and ROAS require both:
A selected milestone
Leads with assigned values
This report allows you to move beyond basic metrics like clicks and CPL.
You can use it to:
Compare Search vs PMax performance
Identify campaigns generating revenue vs just leads
Spot high-spend, low-conversion campaigns
Justify scaling profitable campaigns
Reduce budget on underperforming campaigns
Instead of optimising for traffic, you can optimise for:
CPA
Revenue
ROAS
Click “Export” in the top-right corner to download the campaign data.
Exports include:
Campaign performance metrics
Selected milestone data
Calculated fields (CPL, CPA, Revenue, ROAS)
This can be used for:
Agency reviews
Monthly marketing meetings
Internal business reporting
Understanding the Pro Plan: Tracking, Ad Optimisation, and Broadcasts
A quick guide to using Boxly Pro for smarter marketing and lead tracking.
Upgrade to Boxly’s Pro PlanBoxly is here to help you work smarter, not harder, let’s keep streamlining your lead management together!
Contact us at [email protected] if you need any assistance!