Dentally Financials shows you how much your leads have actually been invoiced and paid in Dentally, right inside your Boxly reports.
Dentally Financials is not an estimate. It shows: "Here's what this lead has really been invoiced and paid since they came into Boxly."

🎥 Watch how Dentally Financials works:
Until now, Boxly reports have shown an estimated value for each lead, based on the treatment they're interested in. For example, an Invisalign lead might be given an estimated value of £4,500. Estimates are helpful, but they don't show what a patient actually spent.
✅ Dentally Financials solves this. Switch your reports to show the real amounts from Dentally instead of estimates.
This helps practices:
See which marketing campaigns bring in the most revenue
Find out which channels and lead sources lead to paying patients
Understand how much each team member's leads are worth
Make better decisions about where to spend on marketing

To use Dentally Financials, you'll need:
✅ Dentally connected to Boxly – see Dentally & Boxly Integration
✅ Dentally Financials added to your account. It's a paid upgrade, so our team turns it on for you.
How you switch it on depends on the report.
Leads by Milestones, Team Sales, the Ad Spends Report and the Google campaign report have a Value dropdown.
✅ Go to Reports and open the report you want to check, for example Leads by Milestones
✅ Click Value at the top right of the report
✅ Choose the value you want to see
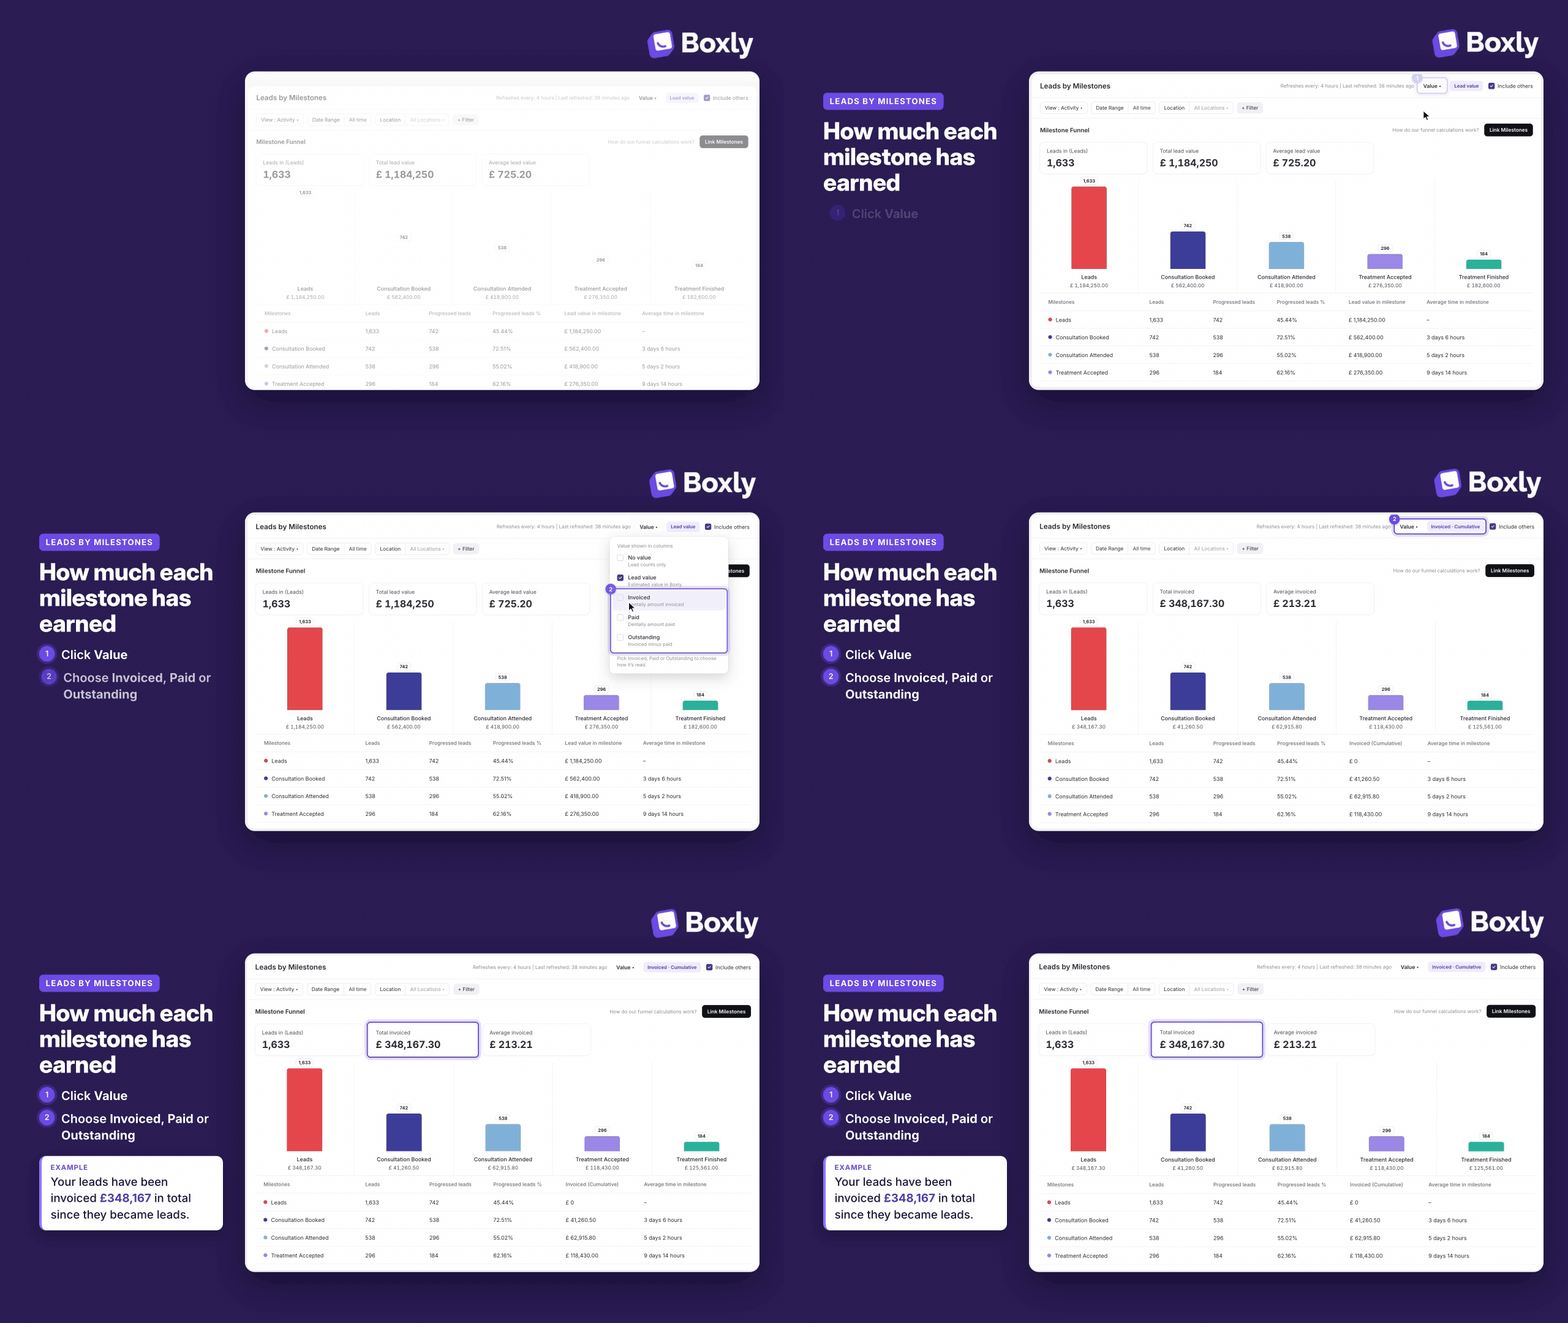
In Leads by Milestones you can choose from:
No value – lead counts only
Lead value – the estimated value Boxly gives each lead, based on the treatment
Invoiced – the total amount invoiced in Dentally since the person became a lead
Paid – the amount the patient has paid so far
Outstanding – the amount invoiced that hasn't been paid yet
The report updates straight away and you can switch between the options as often as you like.
Leads by Channel, Leads by Source, Leads by Treatment, Leads by Location and Leads By UTM have a Financials switch instead.
✅ Open the report
✅ Switch on Financials at the top right
Invoiced, Paid and Outstanding columns appear next to your milestone columns. Switch it off to see milestone values only.
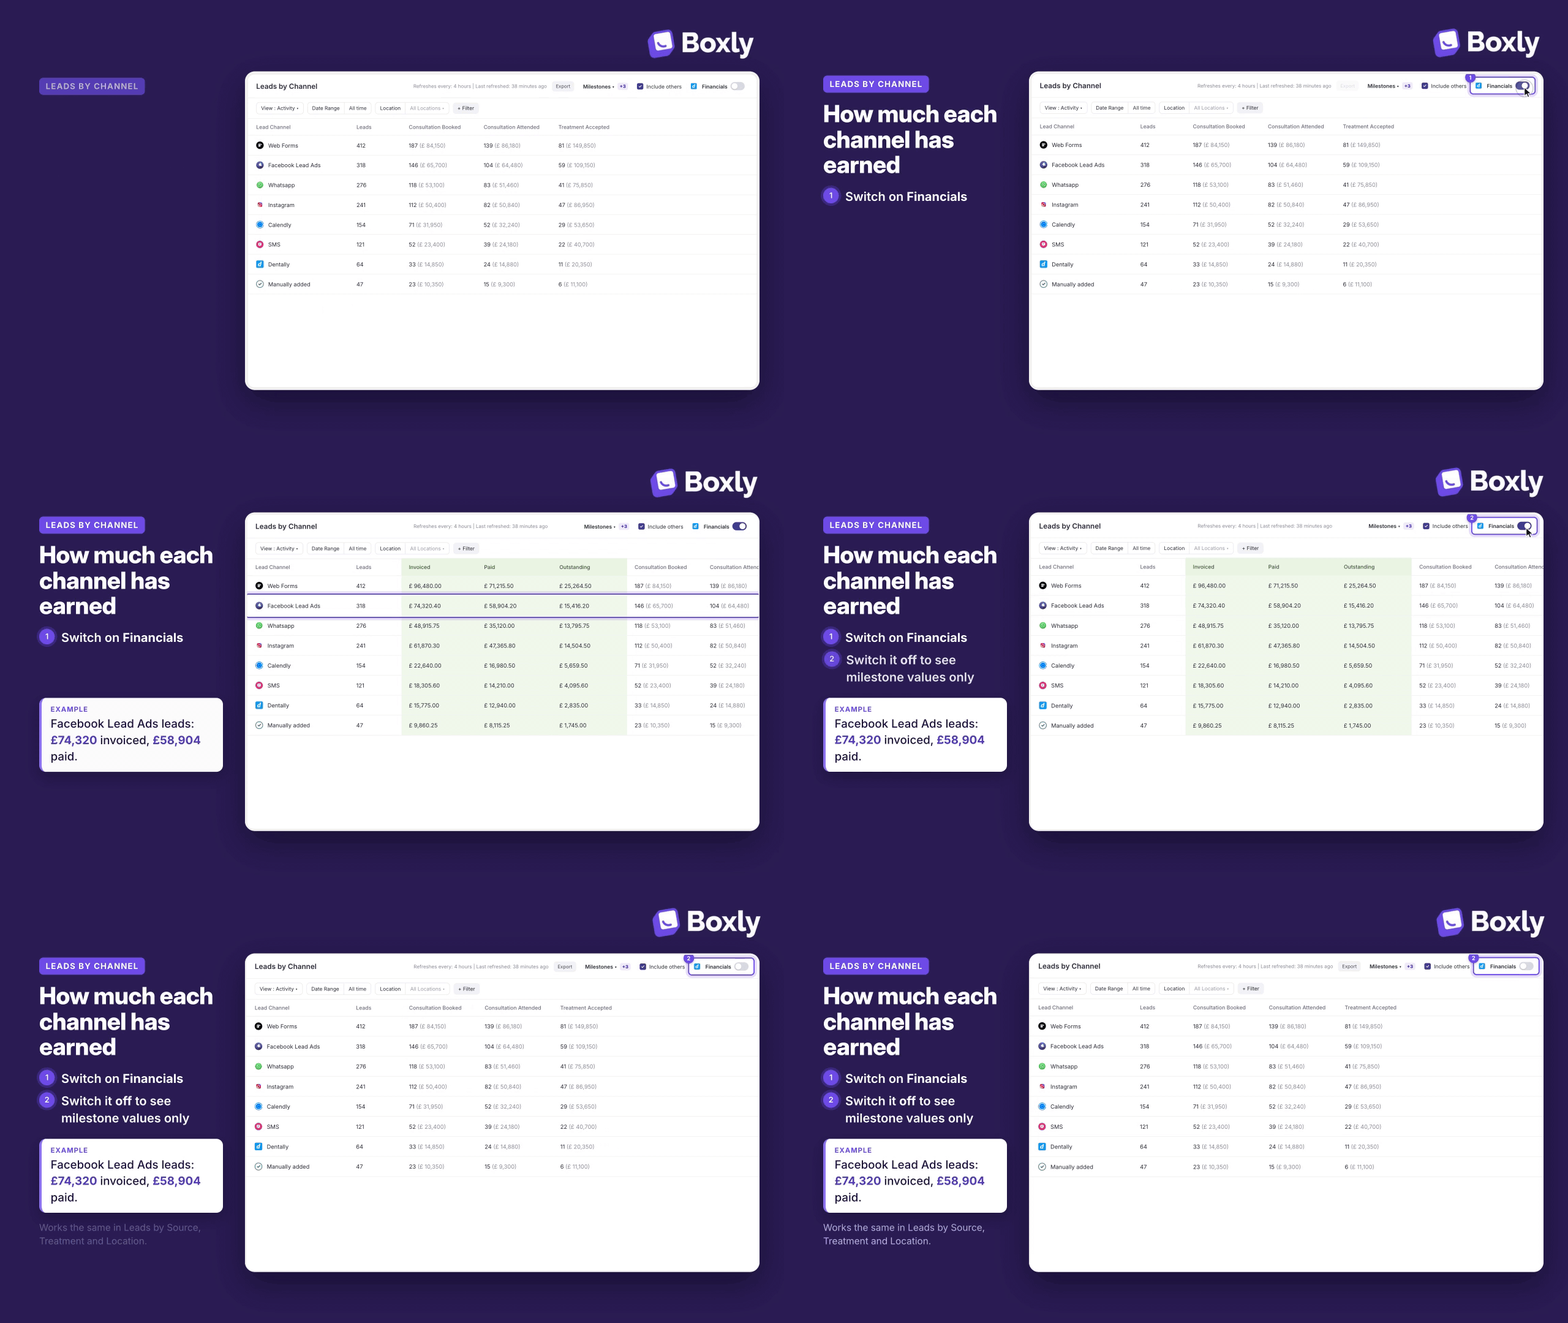
For example, in Leads by Channel you can see that Facebook Lead Ads leads have been invoiced £74,320 and have paid £58,904.
When you choose Invoiced, Paid or Outstanding in Leads by Milestones, the boxes at the top of the report show:
Leads – the number of leads in the report
Total – the total invoiced, paid or outstanding for those leads
Average – the total divided by the number of leads
Paid amounts show in green, outstanding amounts in red and invoiced amounts in black, so they're easy to tell apart.
You can see Dentally Financials in these reports:
Leads by Milestones
Leads by Channel
Leads by Source
Leads by Treatment
Leads by Location
Leads by Referral
Practitioner Conversion
Leads By UTM
Team Sales
Ad Spends Report
Google campaign report
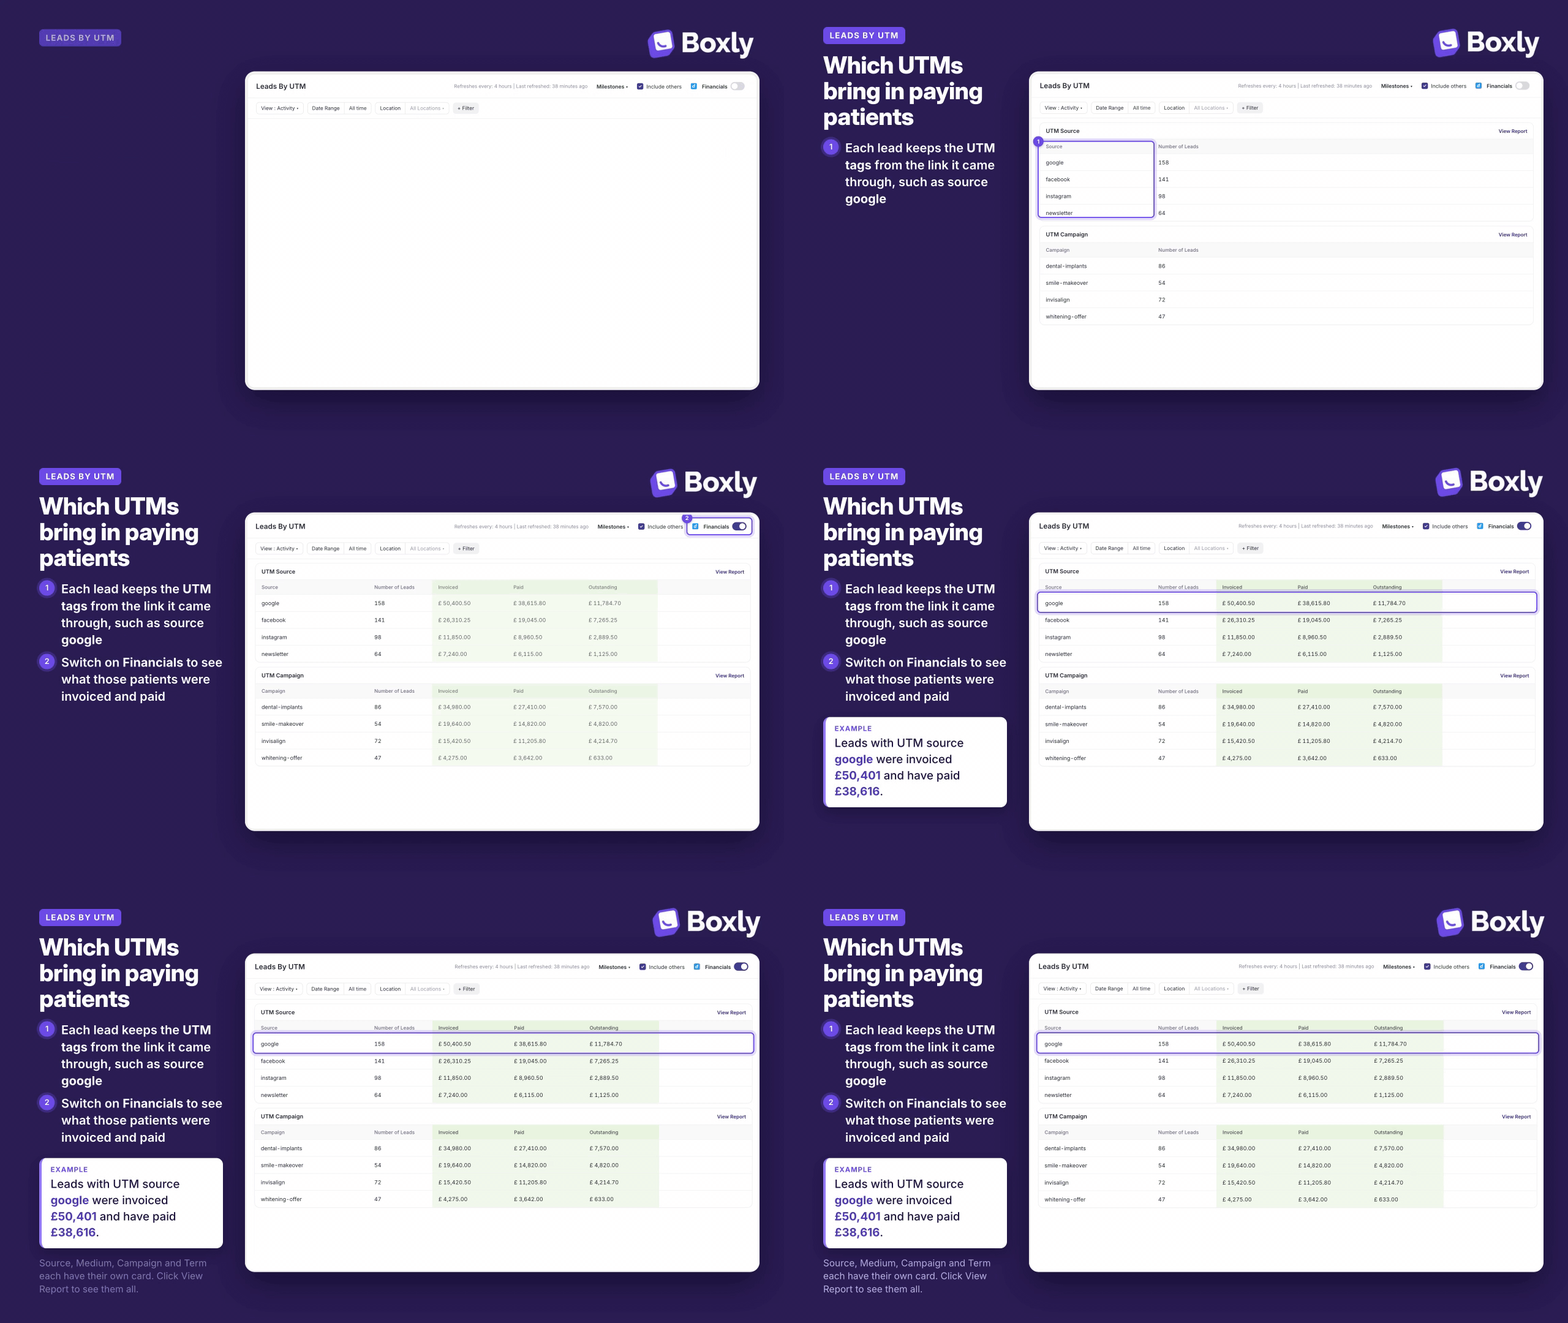
If your ads and campaign links use UTM tracking codes, Leads By UTM shows how much revenue each campaign has brought in, not just how many leads.
✅ Go to Reports → Leads By UTM
✅ Switch on Financials
Source, medium, campaign and term each have their own card. Click View Report to see them all.
Your agency runs two Facebook campaigns, one for Invisalign and one for whitening. Both bring in a similar number of leads.
With Dentally Financials switched on, you can see that the Invisalign campaign has brought in far more invoiced revenue, so you know where to spend more.
New to UTM tracking? Read Lead Sources.
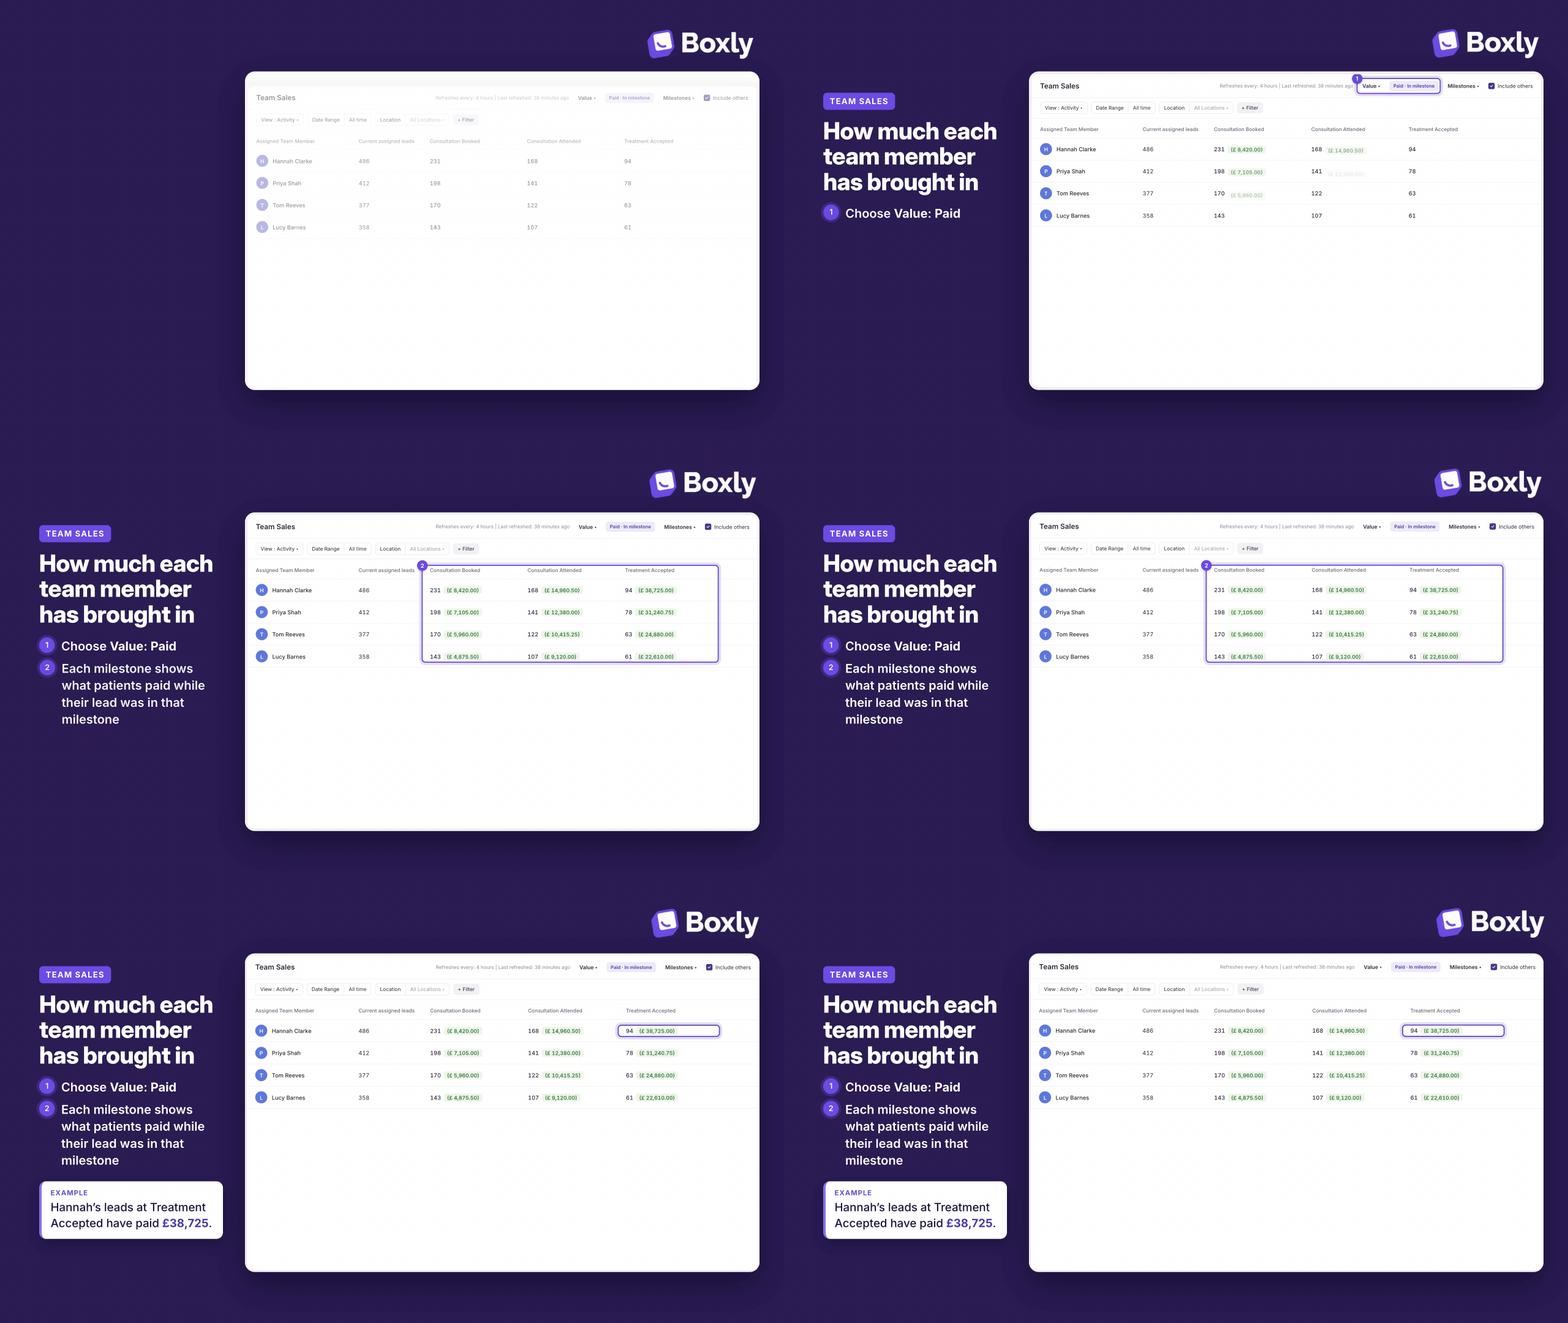
In Leads by Milestones and Team Sales, once you choose Invoiced, Paid or Outstanding, you can also choose how the amounts are counted:
✅ Cumulative → everything the patient had been invoiced or paid by the time they left that milestone, counted from their first enquiry.
✅ In Milestone → only what was invoiced or paid while the lead was in that milestone.
Hannah is one of your team members. In Team Sales, with Paid · In milestone selected, you can see what her leads paid at each milestone:
✅ Consultation Booked → £8,420
✅ Consultation Attended → £14,960.50
✅ Treatment Accepted → £38,725
Each amount is only what was paid while her leads were in that milestone. For example, the £38,725 was paid while her leads were in Treatment Accepted, not before.
Choose Cumulative instead to see a running total from each patient’s first enquiry.
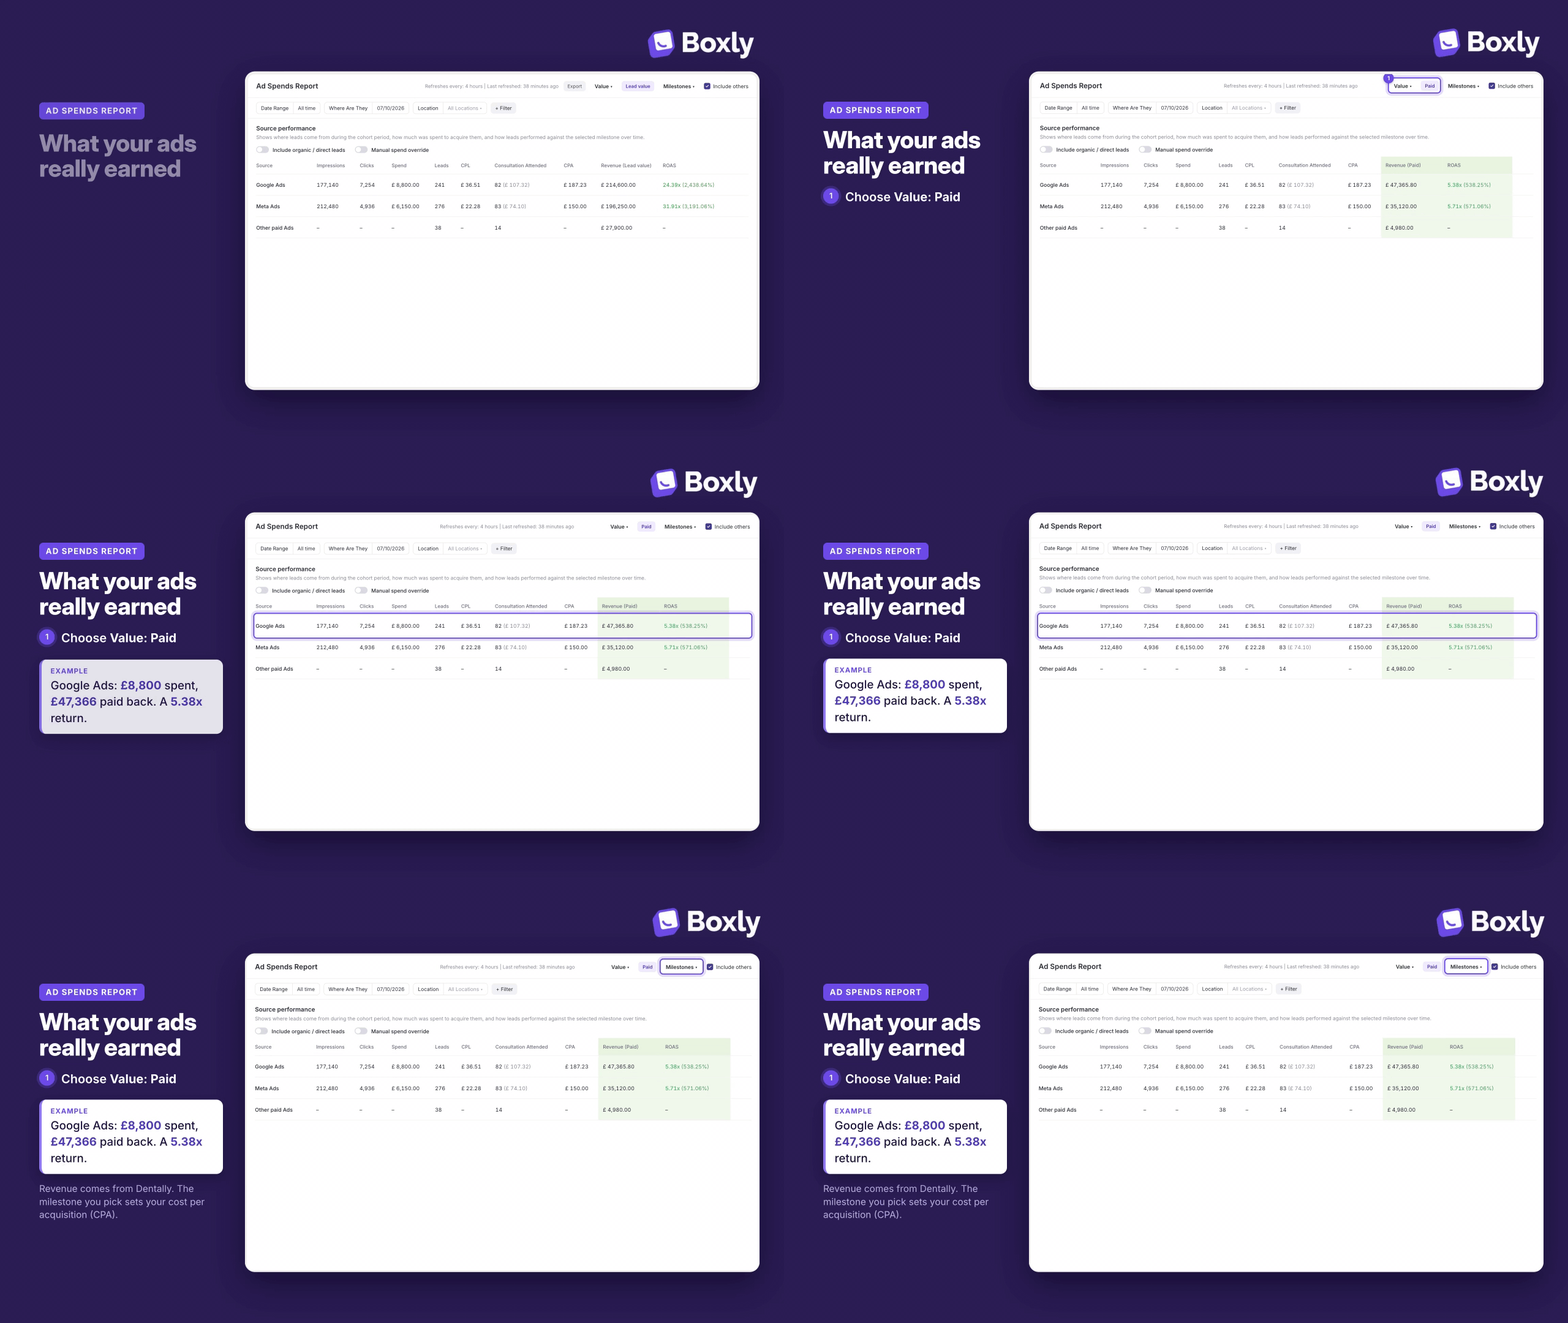
The Ad Spends Report shows what you've spent on Google Ads and Meta Ads. With Dentally Financials, you can also see the revenue those ads have brought in, so you know your real return.
✅ Go to Reports → Ad Spends Report
✅ Click Value and choose Paid
✅ Choose a milestone from Milestones to set your cost per acquisition
The Revenue (Paid) and ROAS columns show what each ad source has brought back for what you spent.
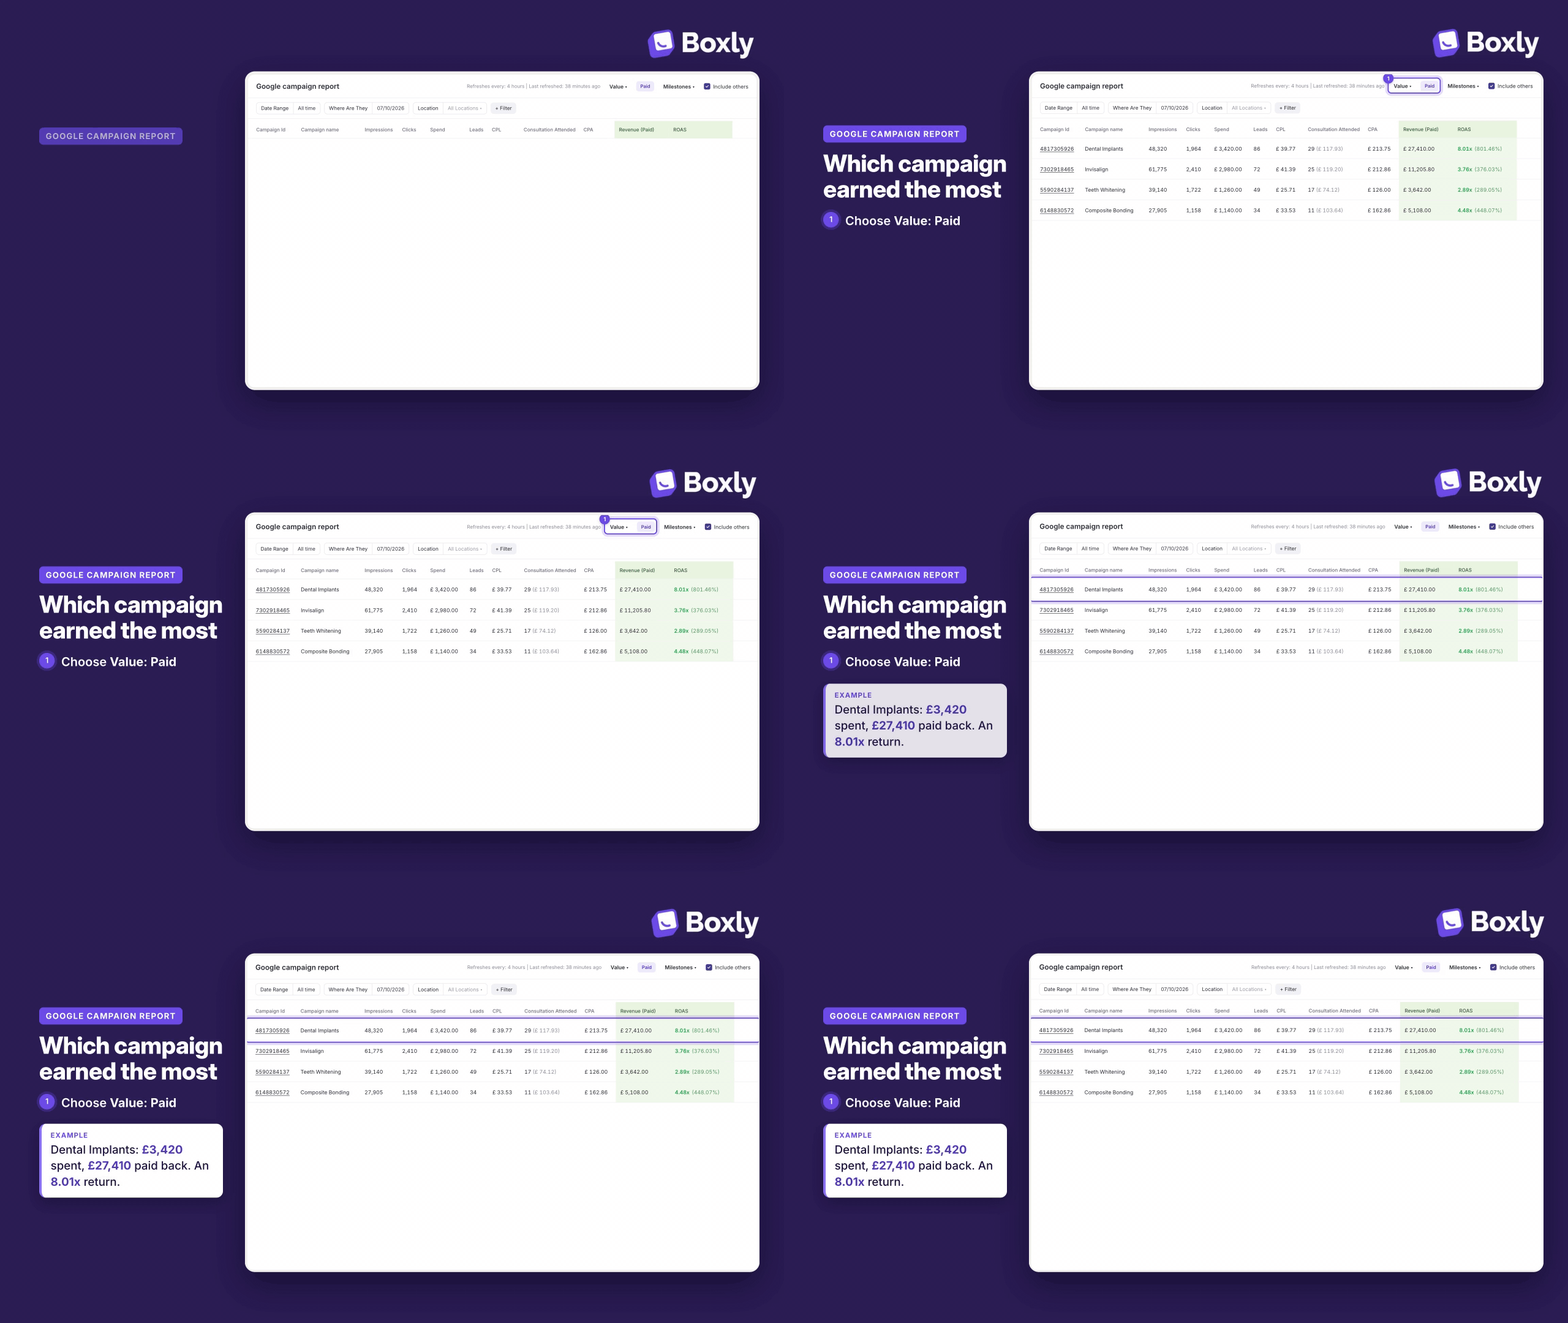
The Google campaign report works the same way, with the revenue for each campaign.
Here's how Dentally Financials helps a typical dental practice.
James is the practice manager at Bright Smile Dental. The practice runs a Google Ads campaign for new patient exams at £75 each.
Looking at the estimated values, the campaign doesn't seem worth the spend. So James opens the Ad Spends Report and switches the Value dropdown to Paid.
He can now see that several of those new patients went on to have whitening and implants in the months that followed. The campaign has brought in far more than the first appointments suggested, so James decides to keep it running.
Why don't I see Dentally Financials in my reports? Dentally Financials is a paid upgrade. Check that Dentally is connected, then contact our support team or your Customer Success Specialist to switch it on.
Does it include what a patient spent before they became a lead? No. It only counts invoices created after the person became a lead in Boxly.
Can I export the figures? No. The Export button is hidden while Financials is switched on.
What's the difference between Cumulative and In Milestone? Cumulative shows everything the patient had spent by the time they left a milestone. In Milestone shows only what they spent while in that milestone.
If you have questions about Dentally Financials or need help switching it on, our support team or your Customer Success Specialist will be happy to help.
Contact us anytime at [email protected].
Dentally & Boxly Integration
Guide to Integrating Dentally and Boxly
Leads by Milestone Report
Track how leads progress through key milestones