We’ve redesigned Boxly’s reporting system to be smarter, more insightful, and truly built around you. Our new reports are more interactive, flexible, and packed with features that help you understand what’s happening in your business, without the guesswork.
From tracking multiple conversions to breaking down team performance by business hours, this upgrade is all about giving you clarity, control, and confidence in your data.
Report Name | Team Admin | Team Member |
Lead by Milestone Report | Yes | Yes |
Leads by Box Report | Yes | Yes |
Leads by Channel Report | Yes | Yes |
Leads by Source Report | Yes | Yes |
Leads by Treatment Report | Yes | Yes |
Leads by Location Report (Only Shows if the User is on a Location Plan) | Yes | Yes |
Leads by Referral Report (Only Shows if the User Has a Referral Box) | Yes | Yes |
Team Sales Report | Yes | No |
Reply Team Report | Yes | No |
Team Activity Report | Yes | No |
Practitioner Conversion Report | Yes | Yes |
Lost Leads Report | Yes | Yes |
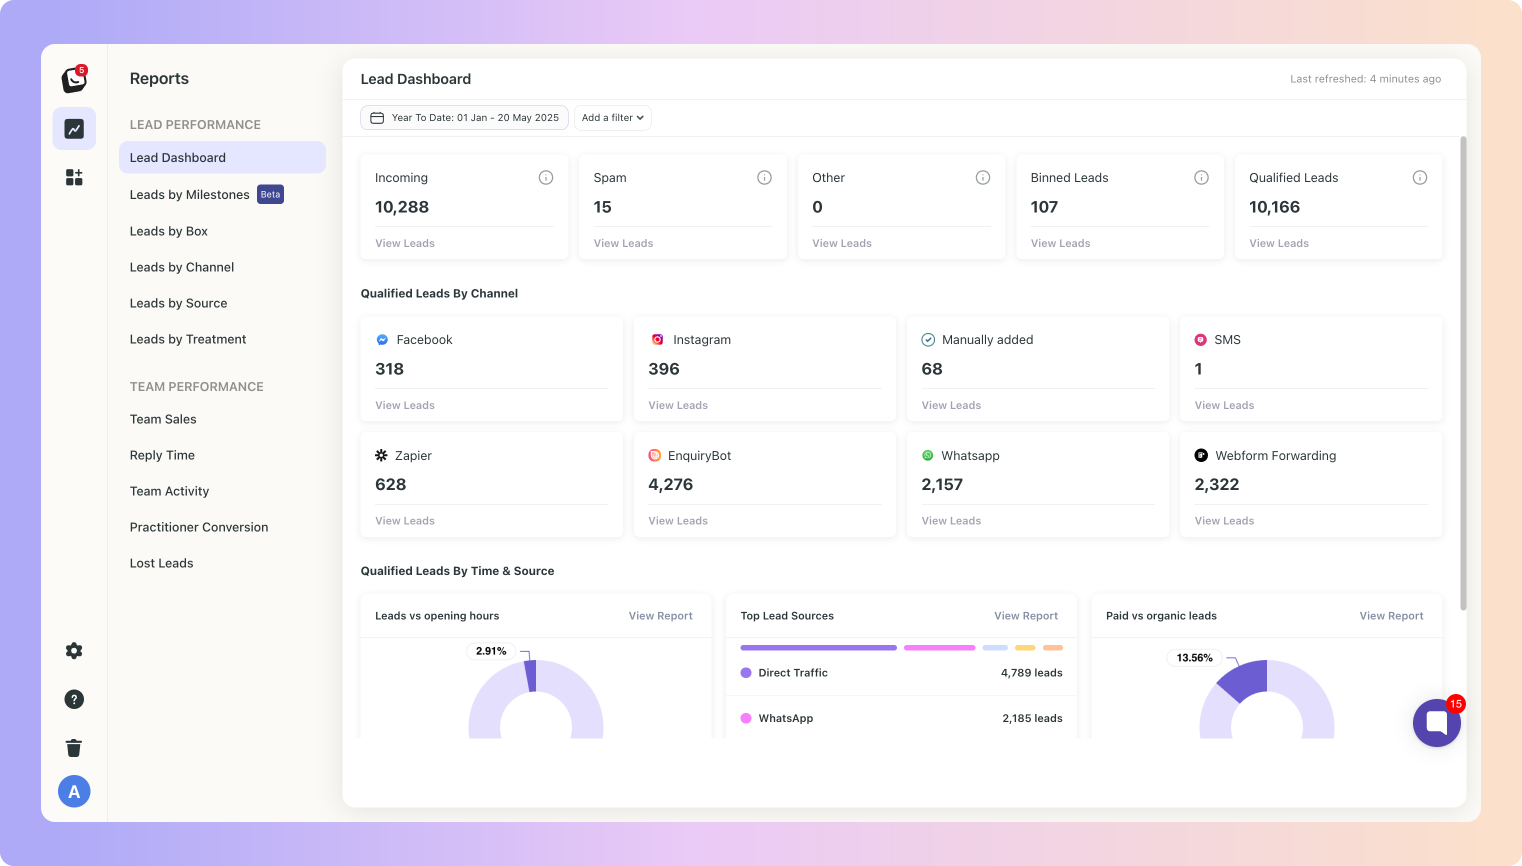
See a live snapshot of everything happening in your business, from new leads to qualified ones. Click any number to drill into the actual data.
👉 Read More about the Lead Dashboard Report
What are Qualified leads?
All leads left after removing any leads marked as Spam, Other, and Binned from Incoming.
Track how leads progress through key milestones like consultation booked or treatment started. Use Activity or Cohort View for flexible insights.
👉 Read More about the Leads by Milestones Report
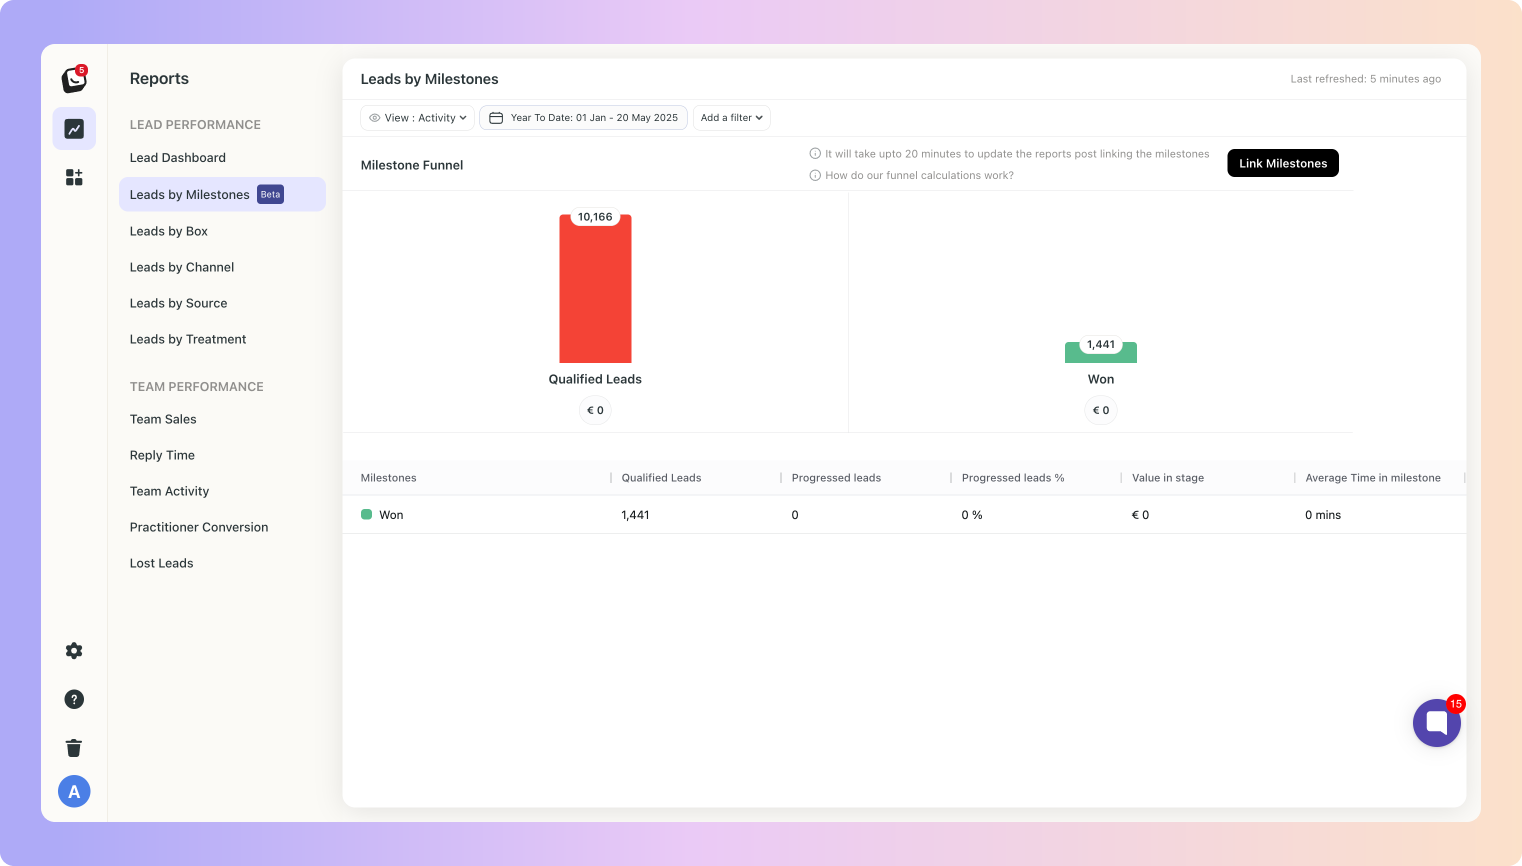
✨ Head over to the Milestone article to get the full run down.
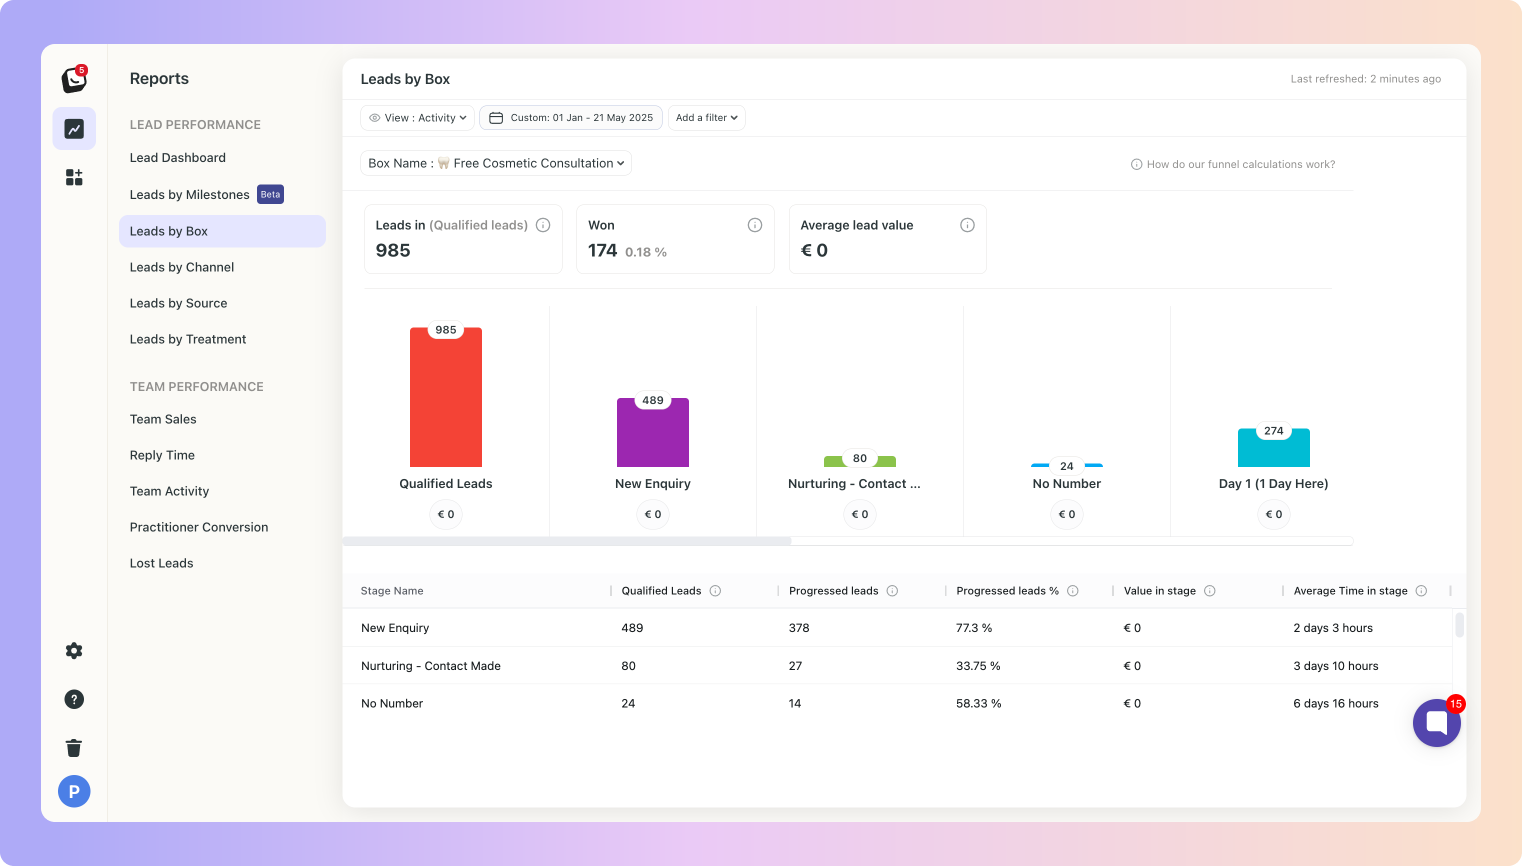
Break down lead activity & reporting by the stages in each Box. This report allows for a better understanding of how well each service or workflow is converting.
👉 Read More about the Leads by Box Report
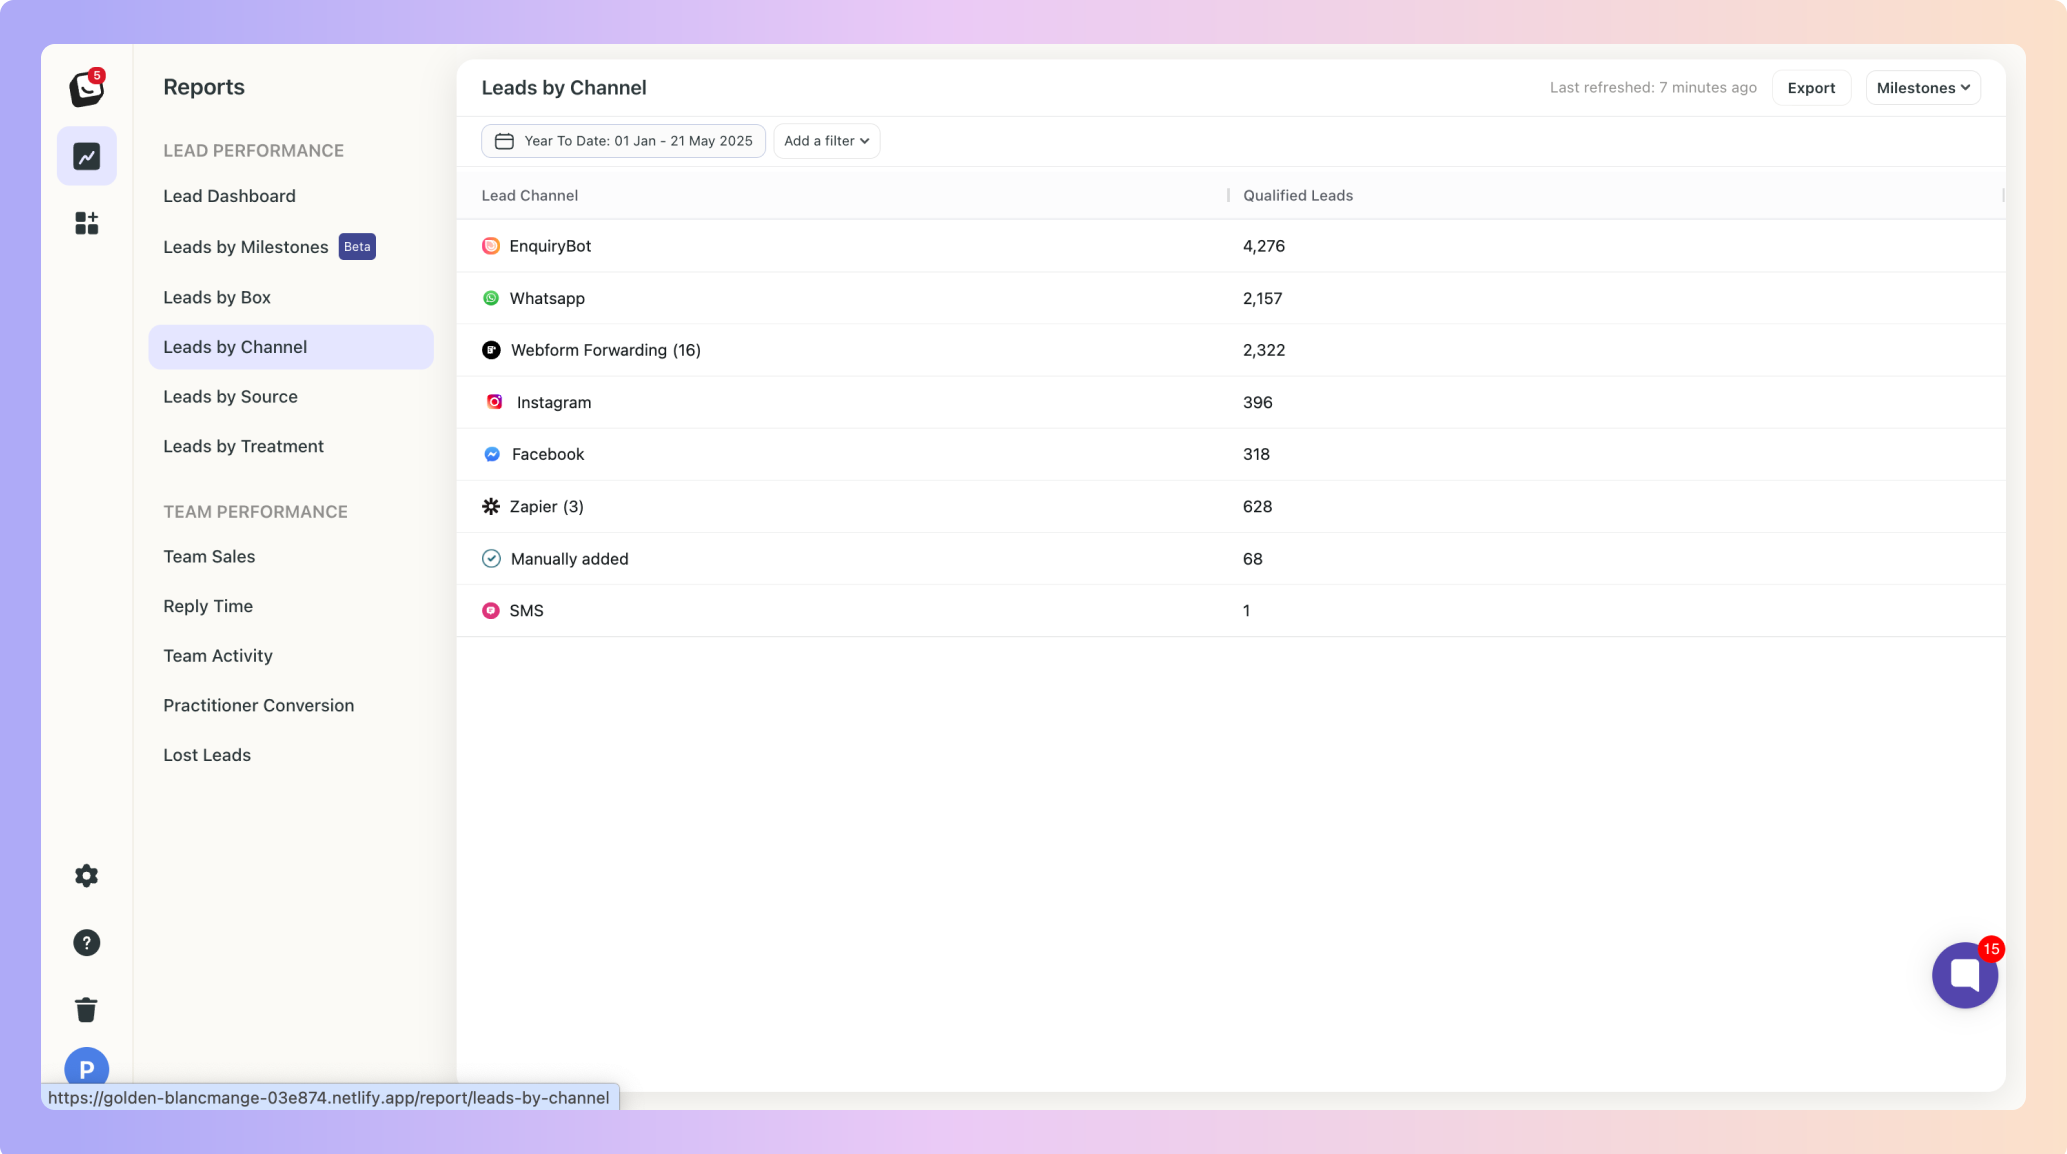
See where your leads are coming from; WhatsApp, Email, Facebook, and more. You can explore sub-channels and the real leads behind the numbers.
👉 Read More about the Leads by Channel Report
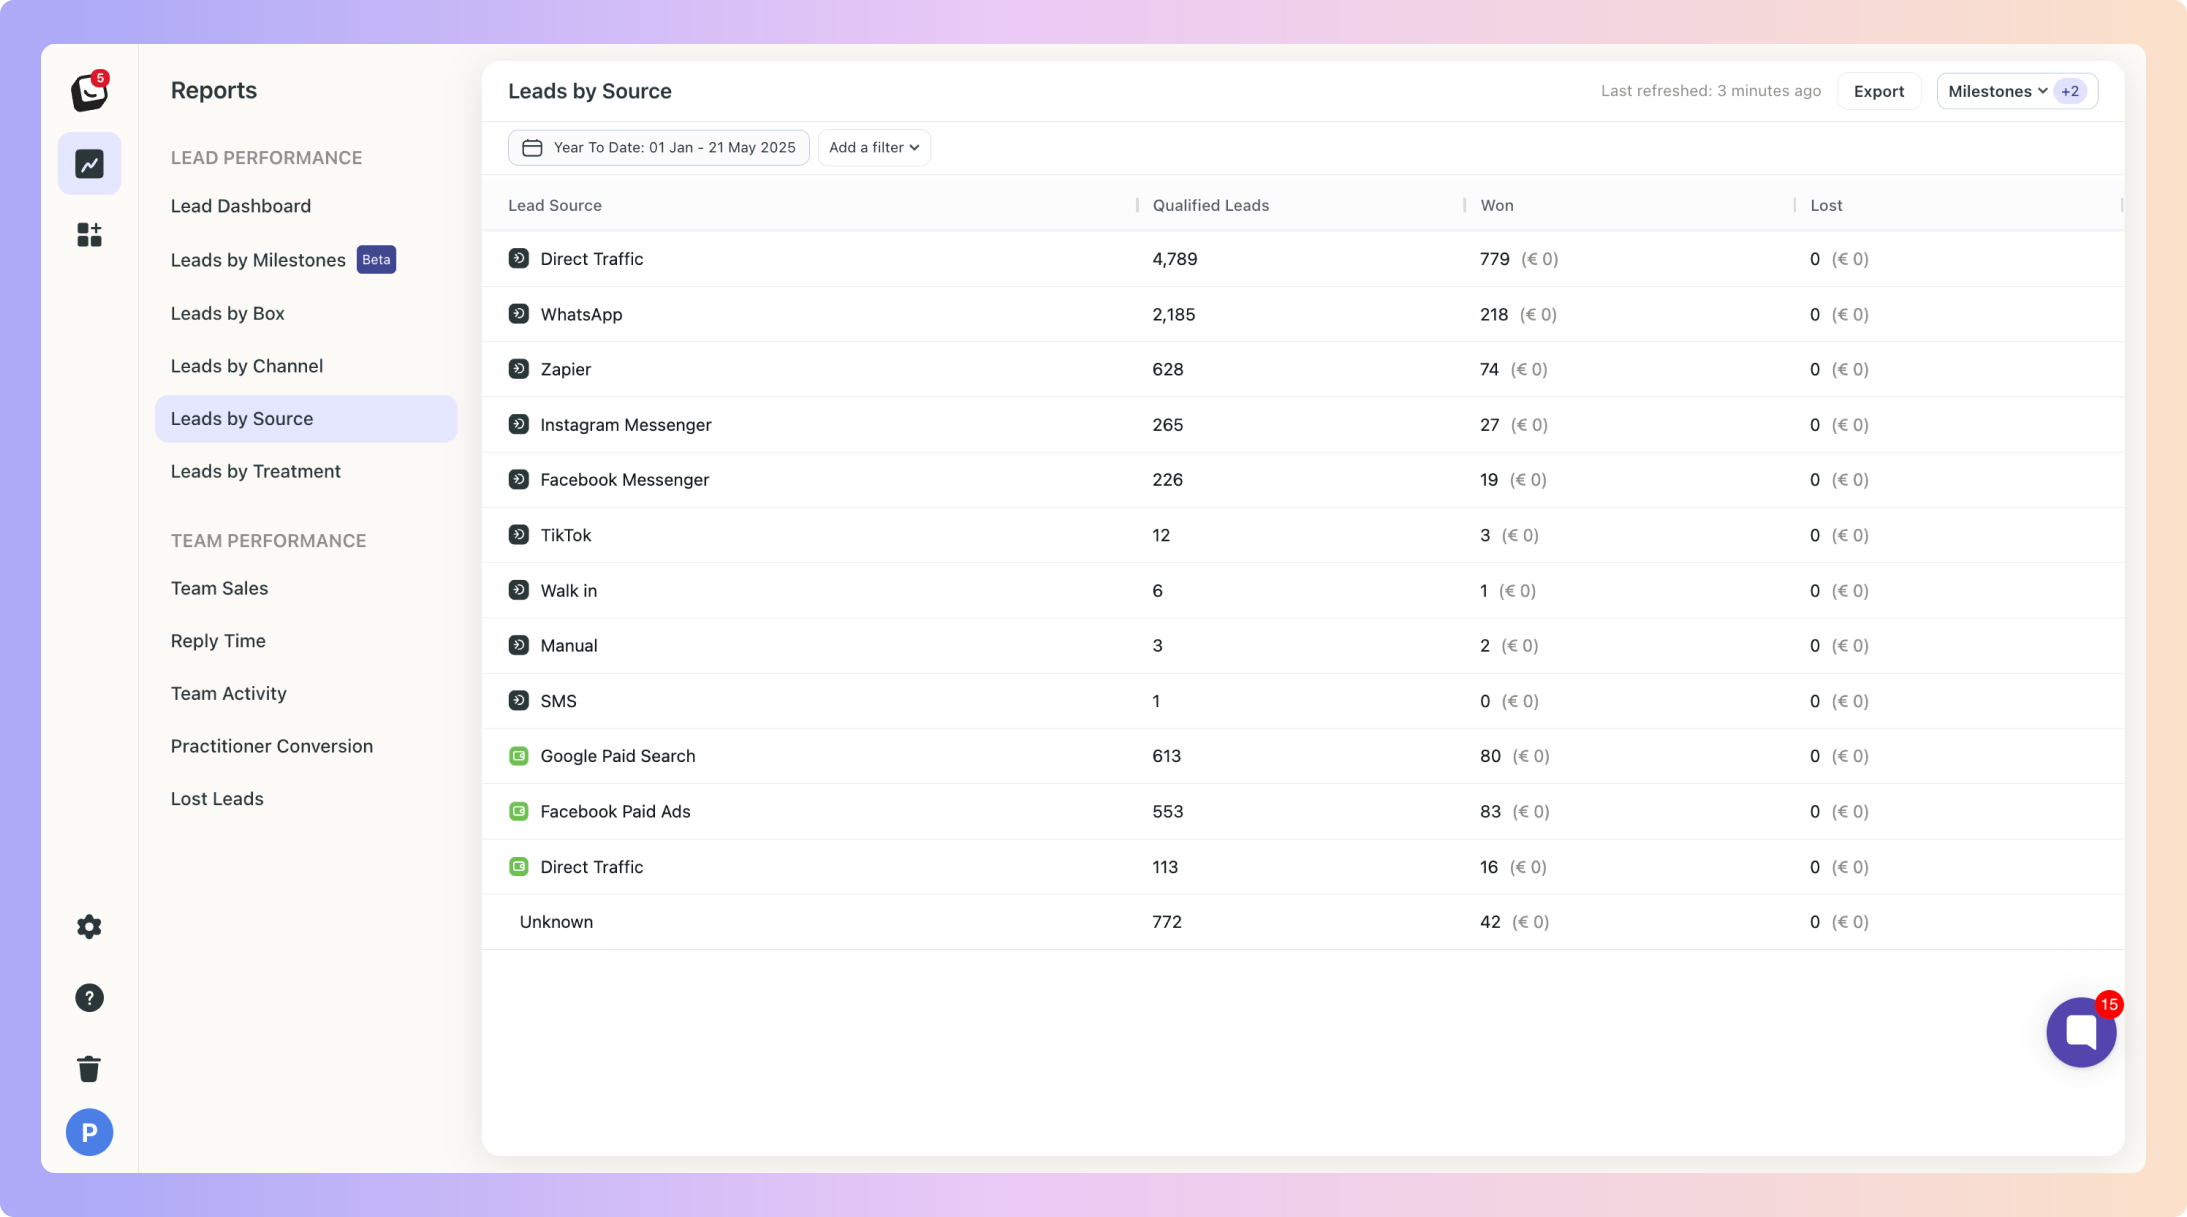
View your top-performing sources at a glance. This report dives into where your leads are coming from and lays out the data in easy to understand views! Click into each source to see the leads behind the numbers.
👉 Read More about the Leads by Source Report
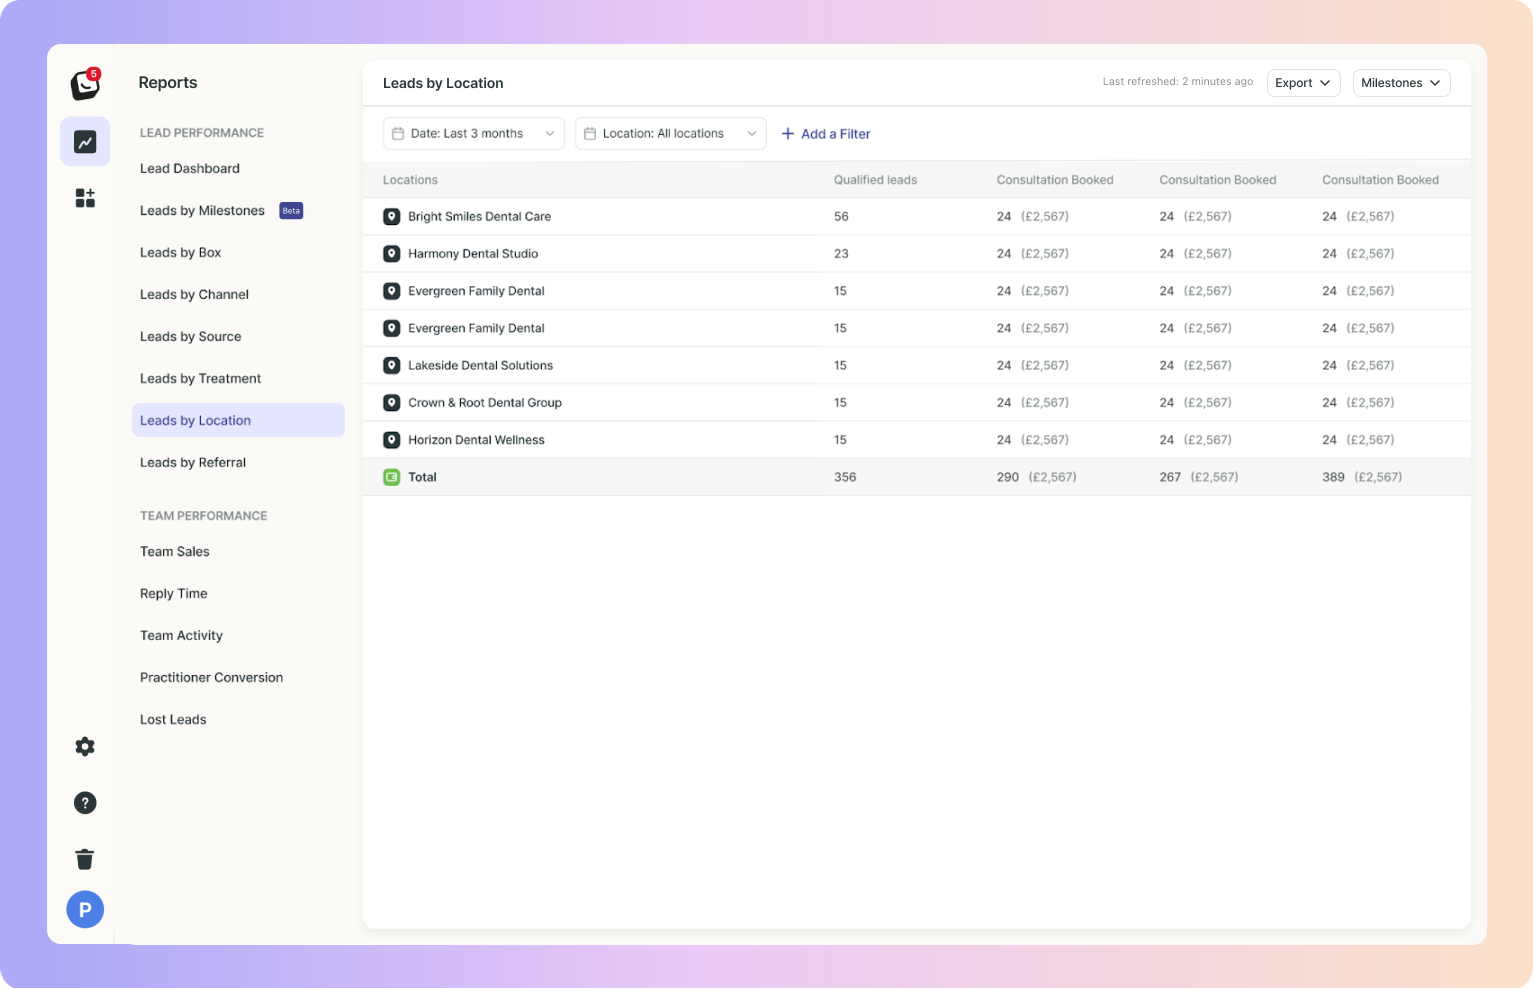
Track lead volume by each location. Helpful for identifying top-performing areas or branches, and which channels are working for them and which aren’t. This report is only applicable to you if you’re on the Location plan.
👉 Read More about the Leads by Location Report
Multi-Location Plan 📍
Powerful plan for businesses with multiple locations, practices or venues to centrally manage all leads in one account.
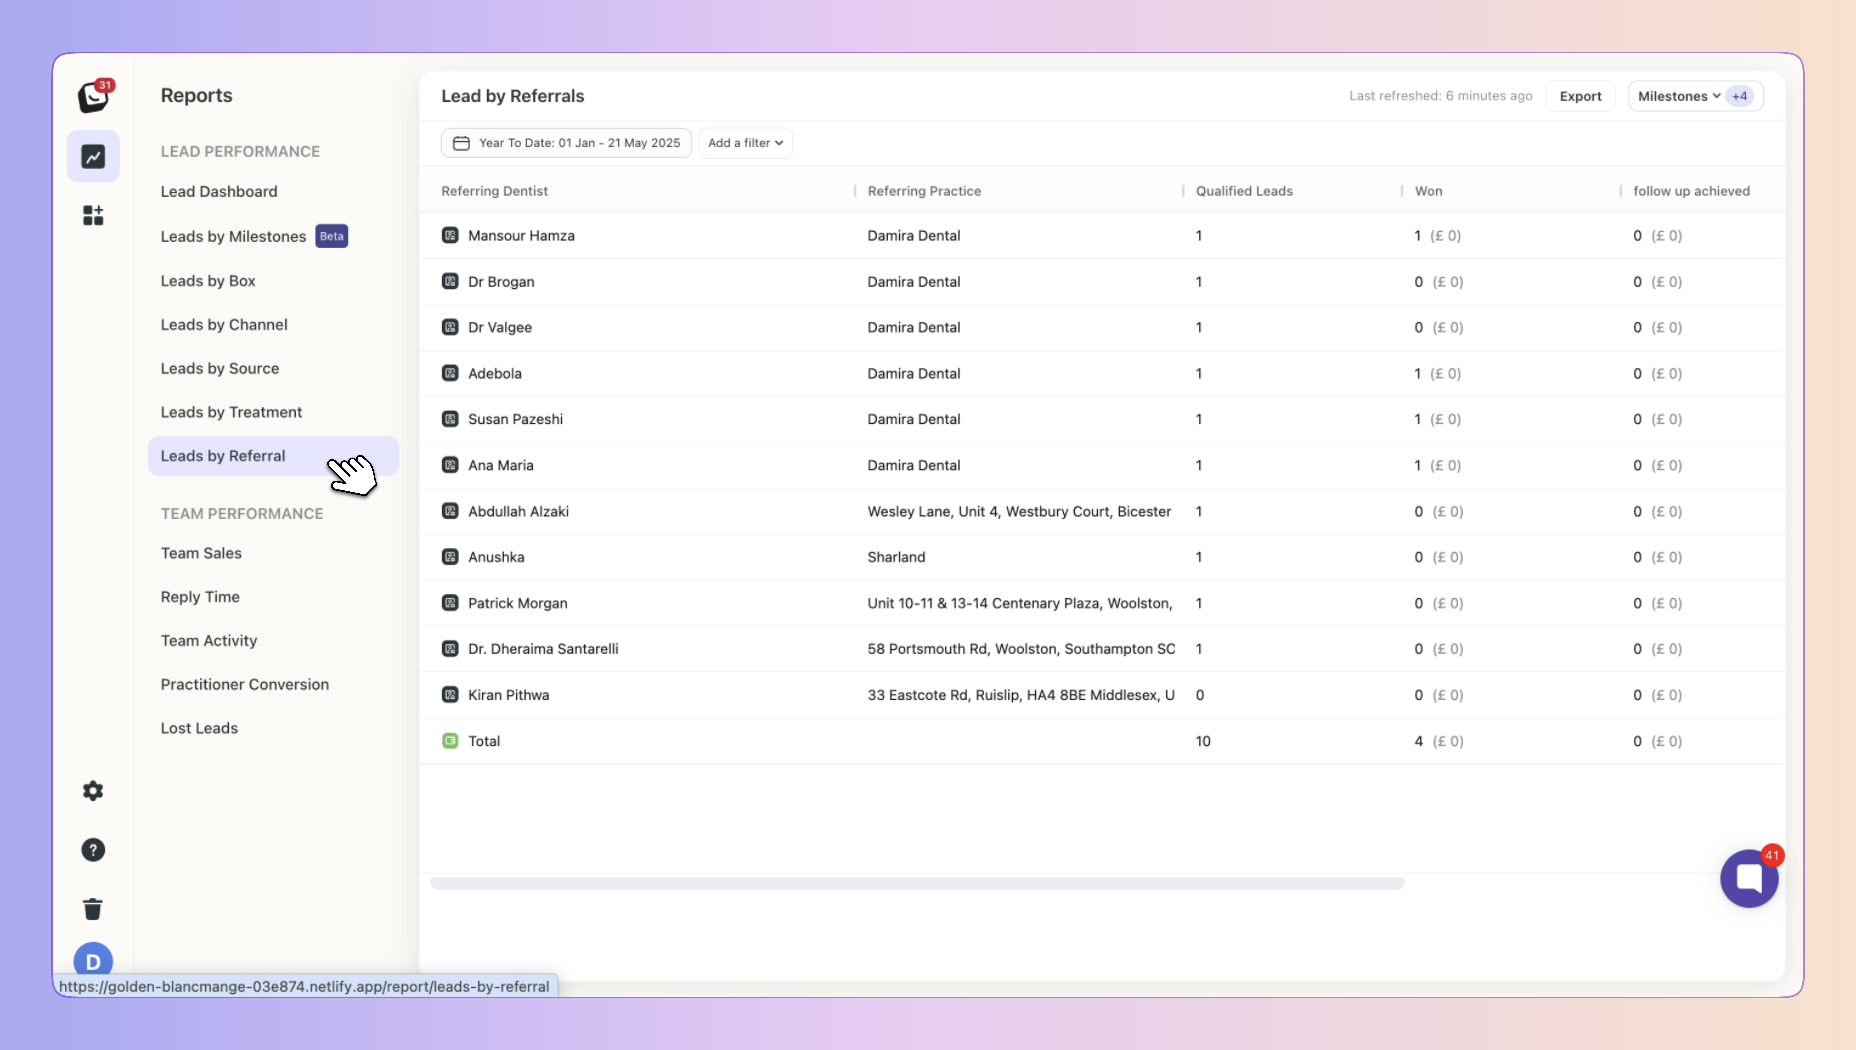
Track which dentists or practices referred new patients to you and how those referrals perform.
👉 Read More about the Leads by Referral Report
Click below and read more about your referral box.
Referral Box
Manage referrals from dentists in one place
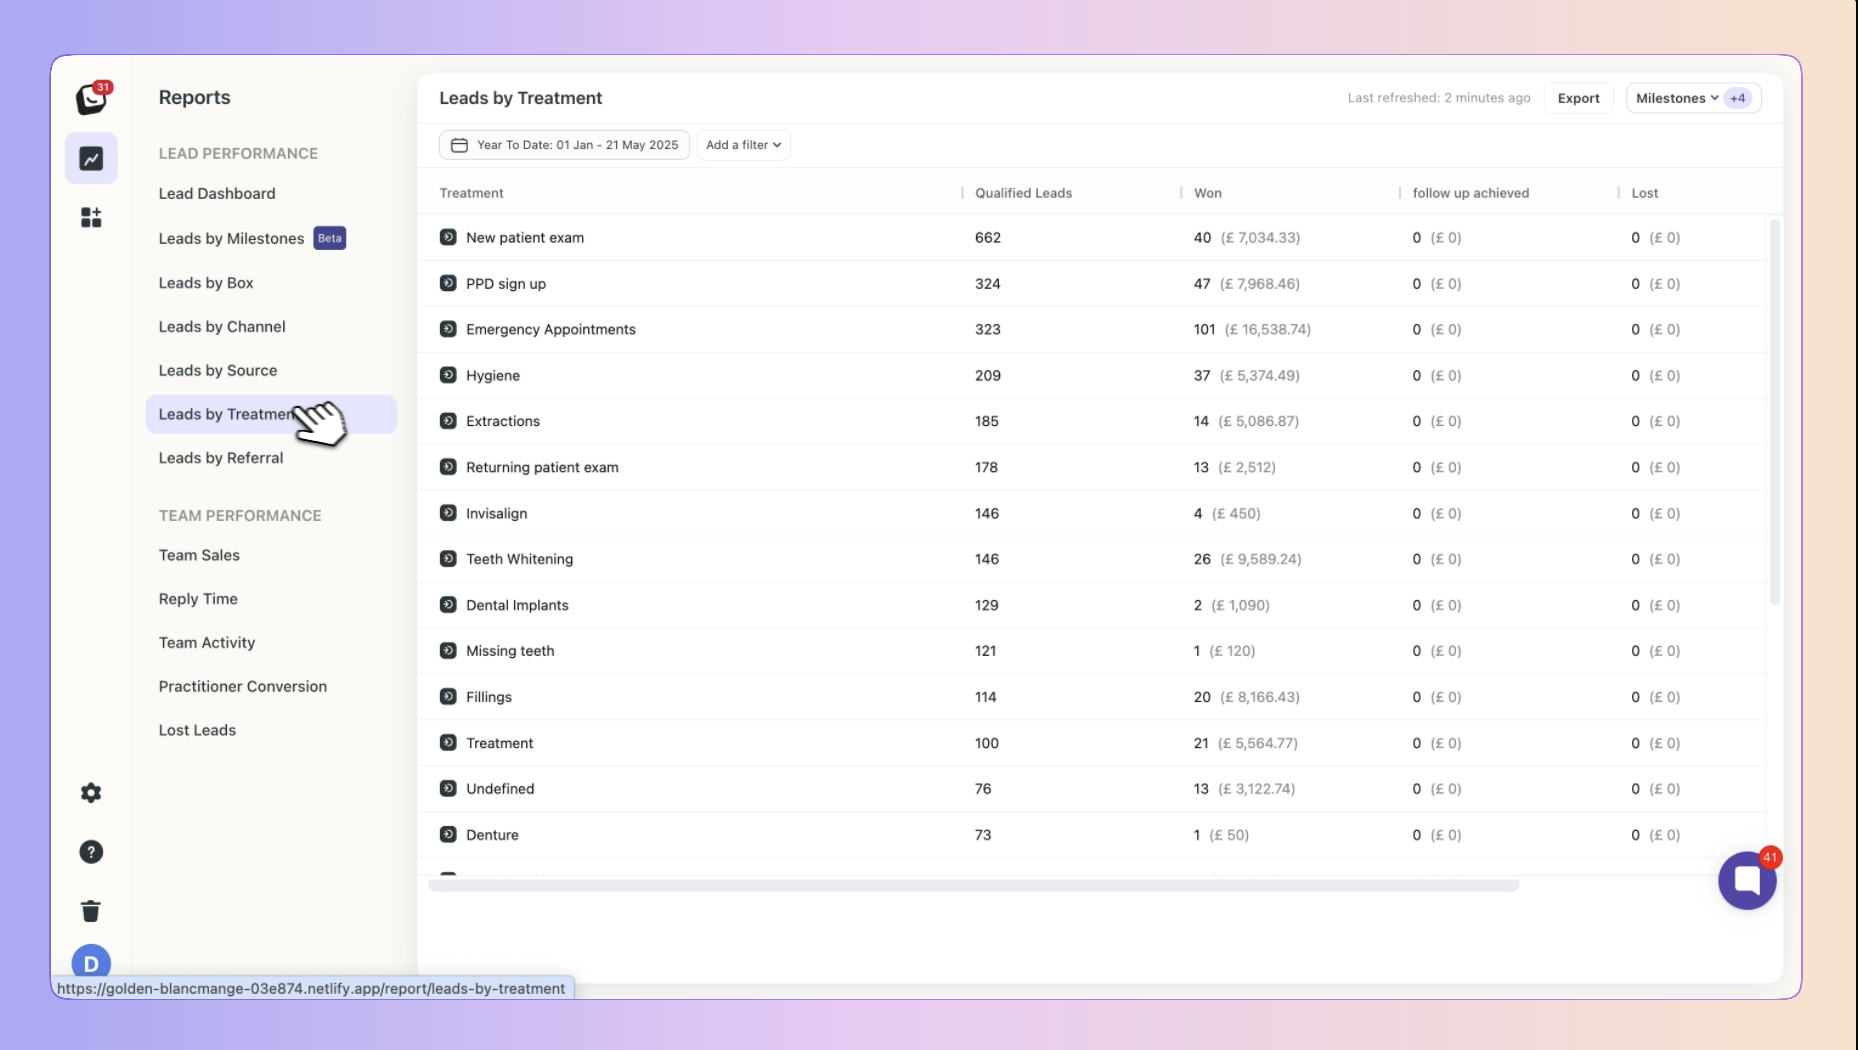
Get a breakdown of how many leads are interested in specific treatments. Ideal for understanding service demand. This report breaks down your data into User, Lead source, Channel, and Box filters, you’ll see the stage progression of all your treatments.
👉 Read More about the Leads by Treatment Report
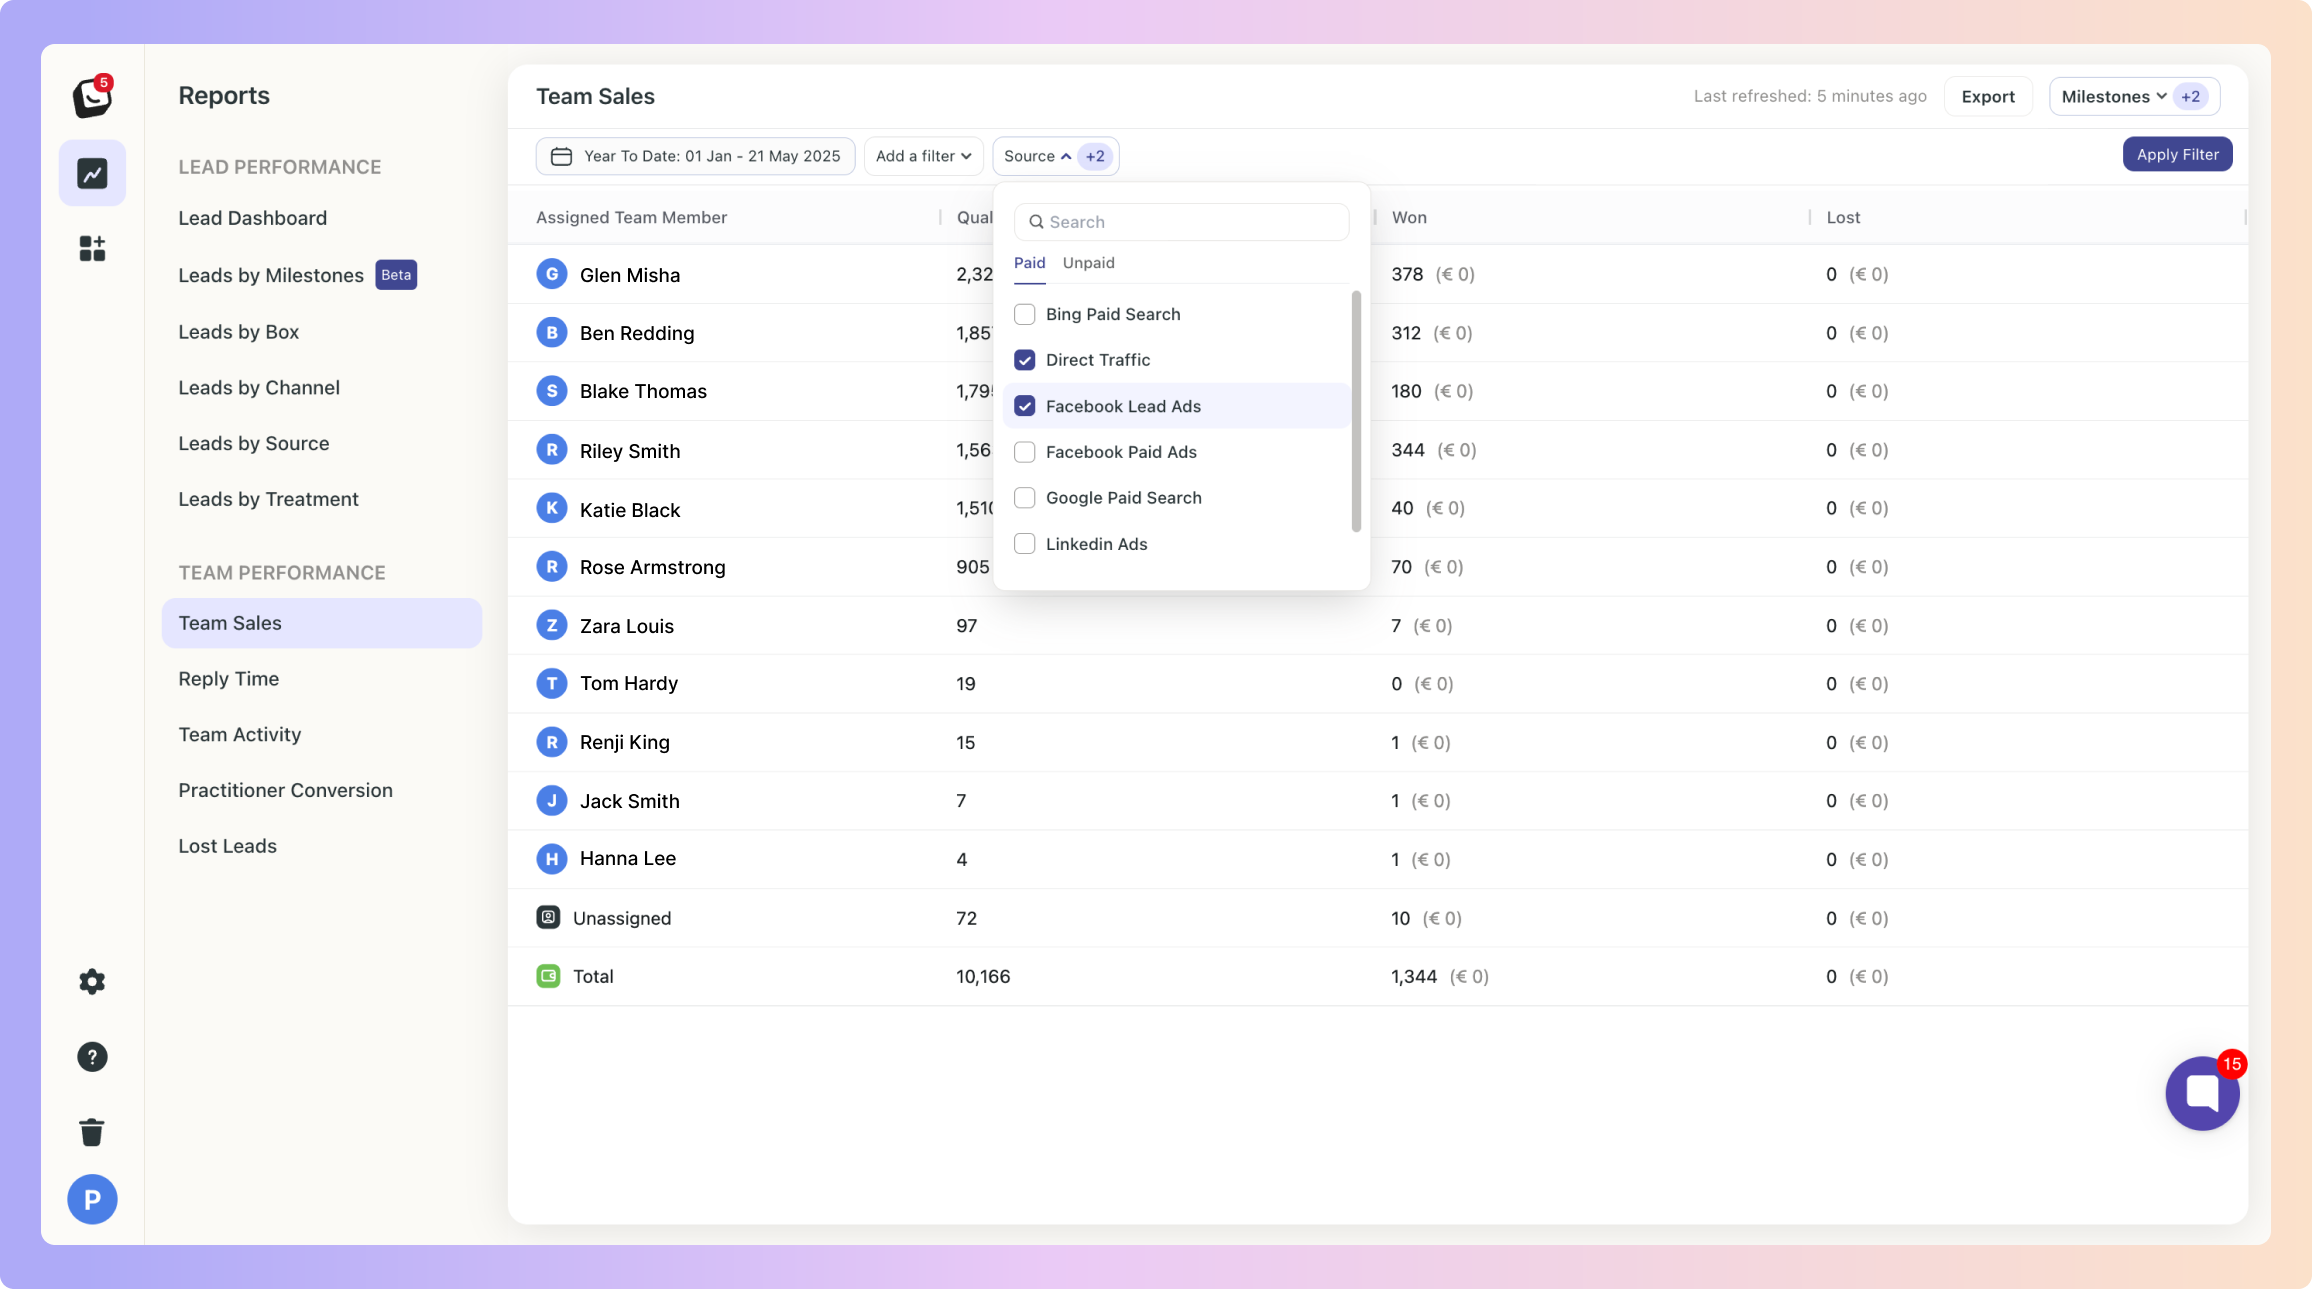
See how many leads each team member has handled and converted. Use milestones to track who’s driving results.
👉 Read More about the Team Sales Report
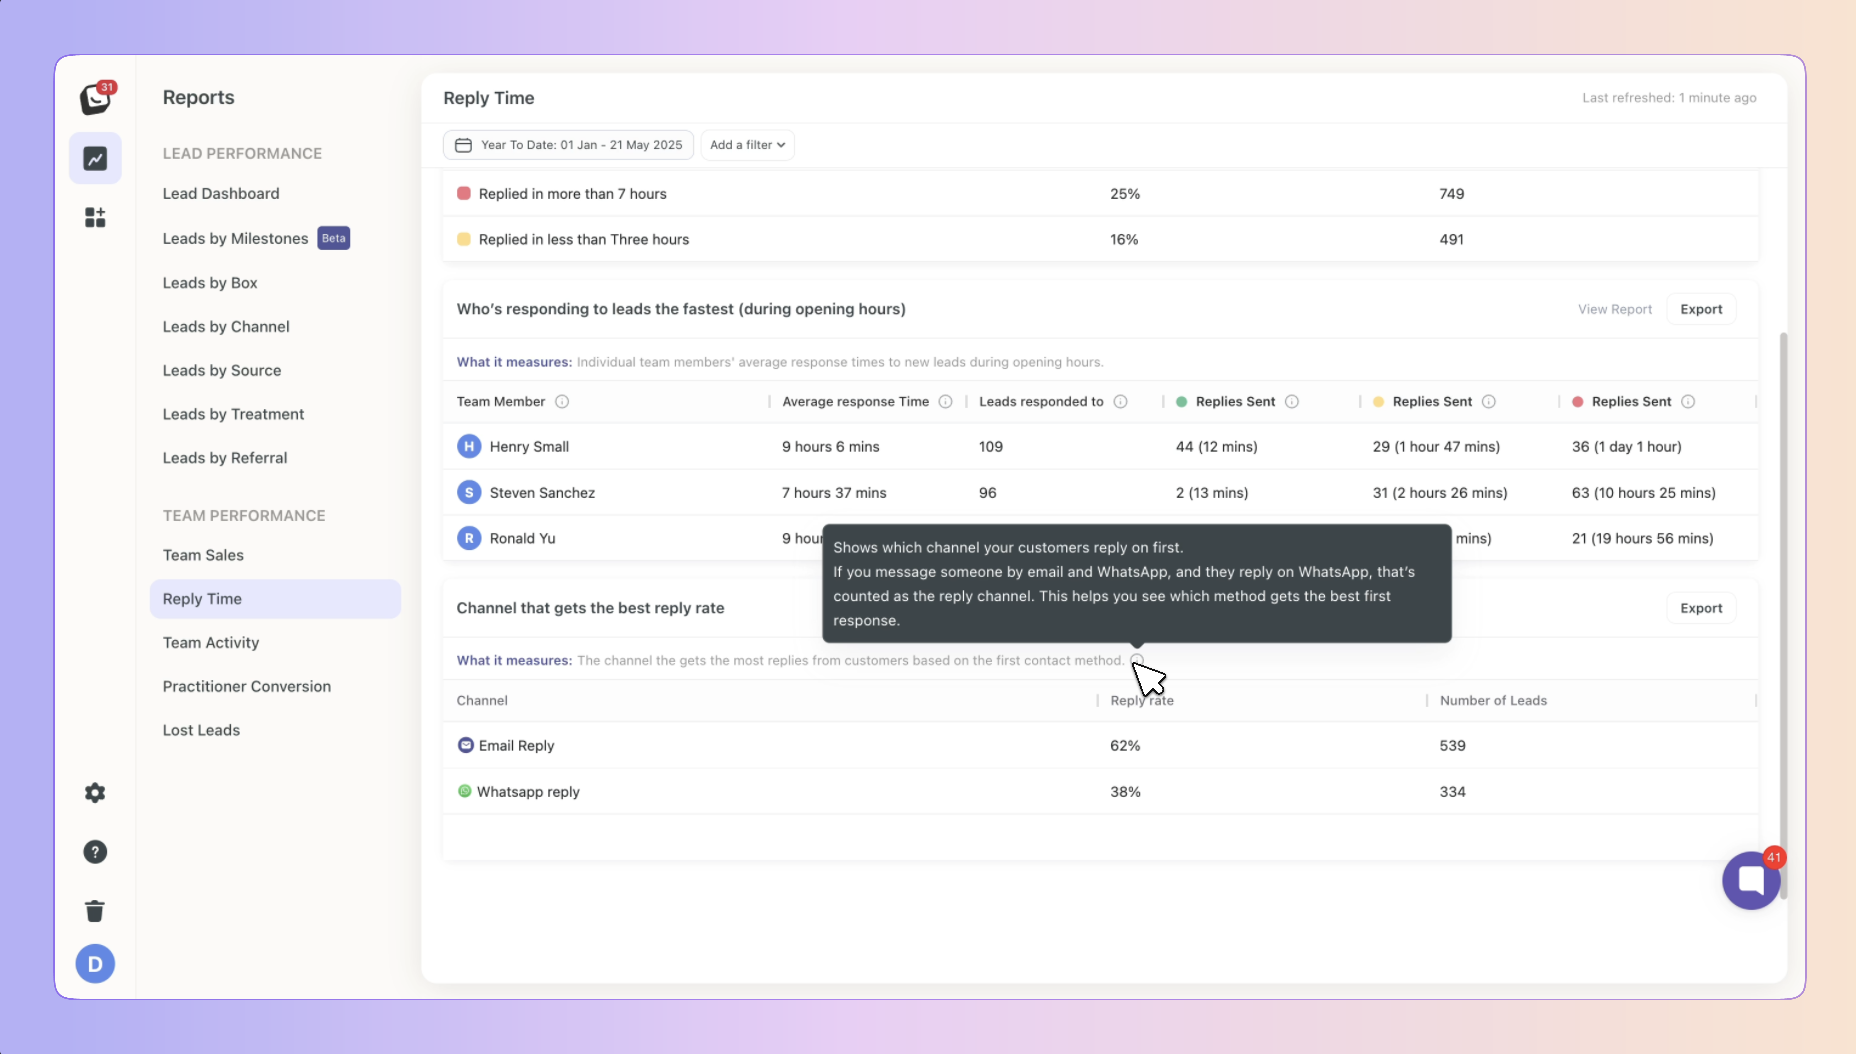
Track how fast your team replies to new leads and which channels (SMS, Email, WhatsApp) perform best.
👉 Read More about the Reply Time Report
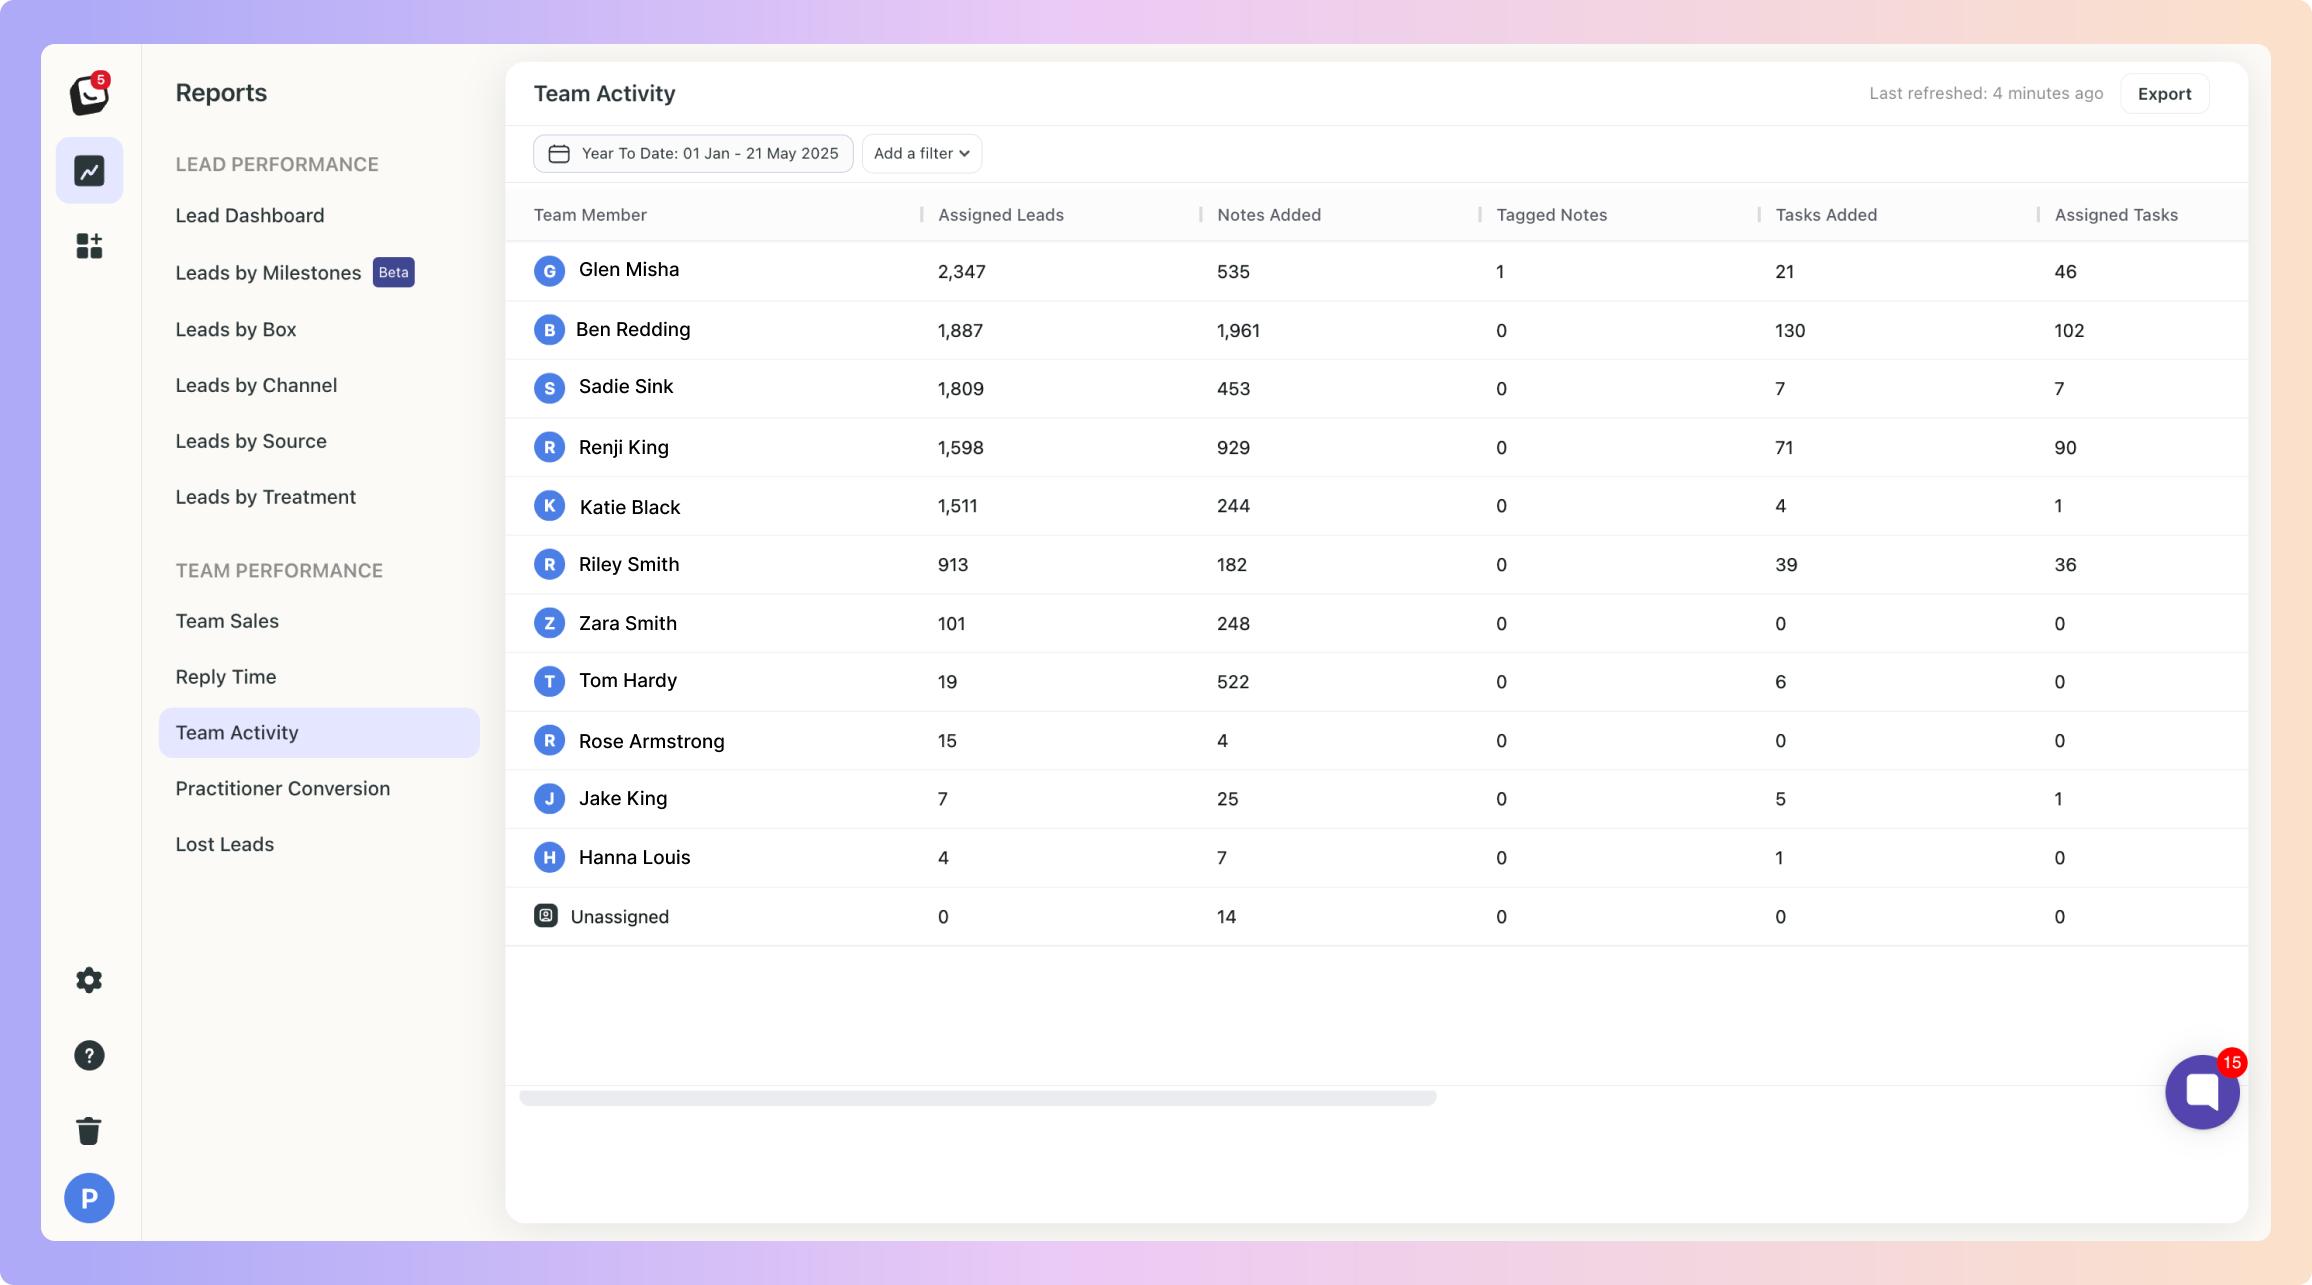
A manager’s dream - see what each team member has done: logins, tasks, notes, messages, and more.
👉 Read More about the Team Activity Report
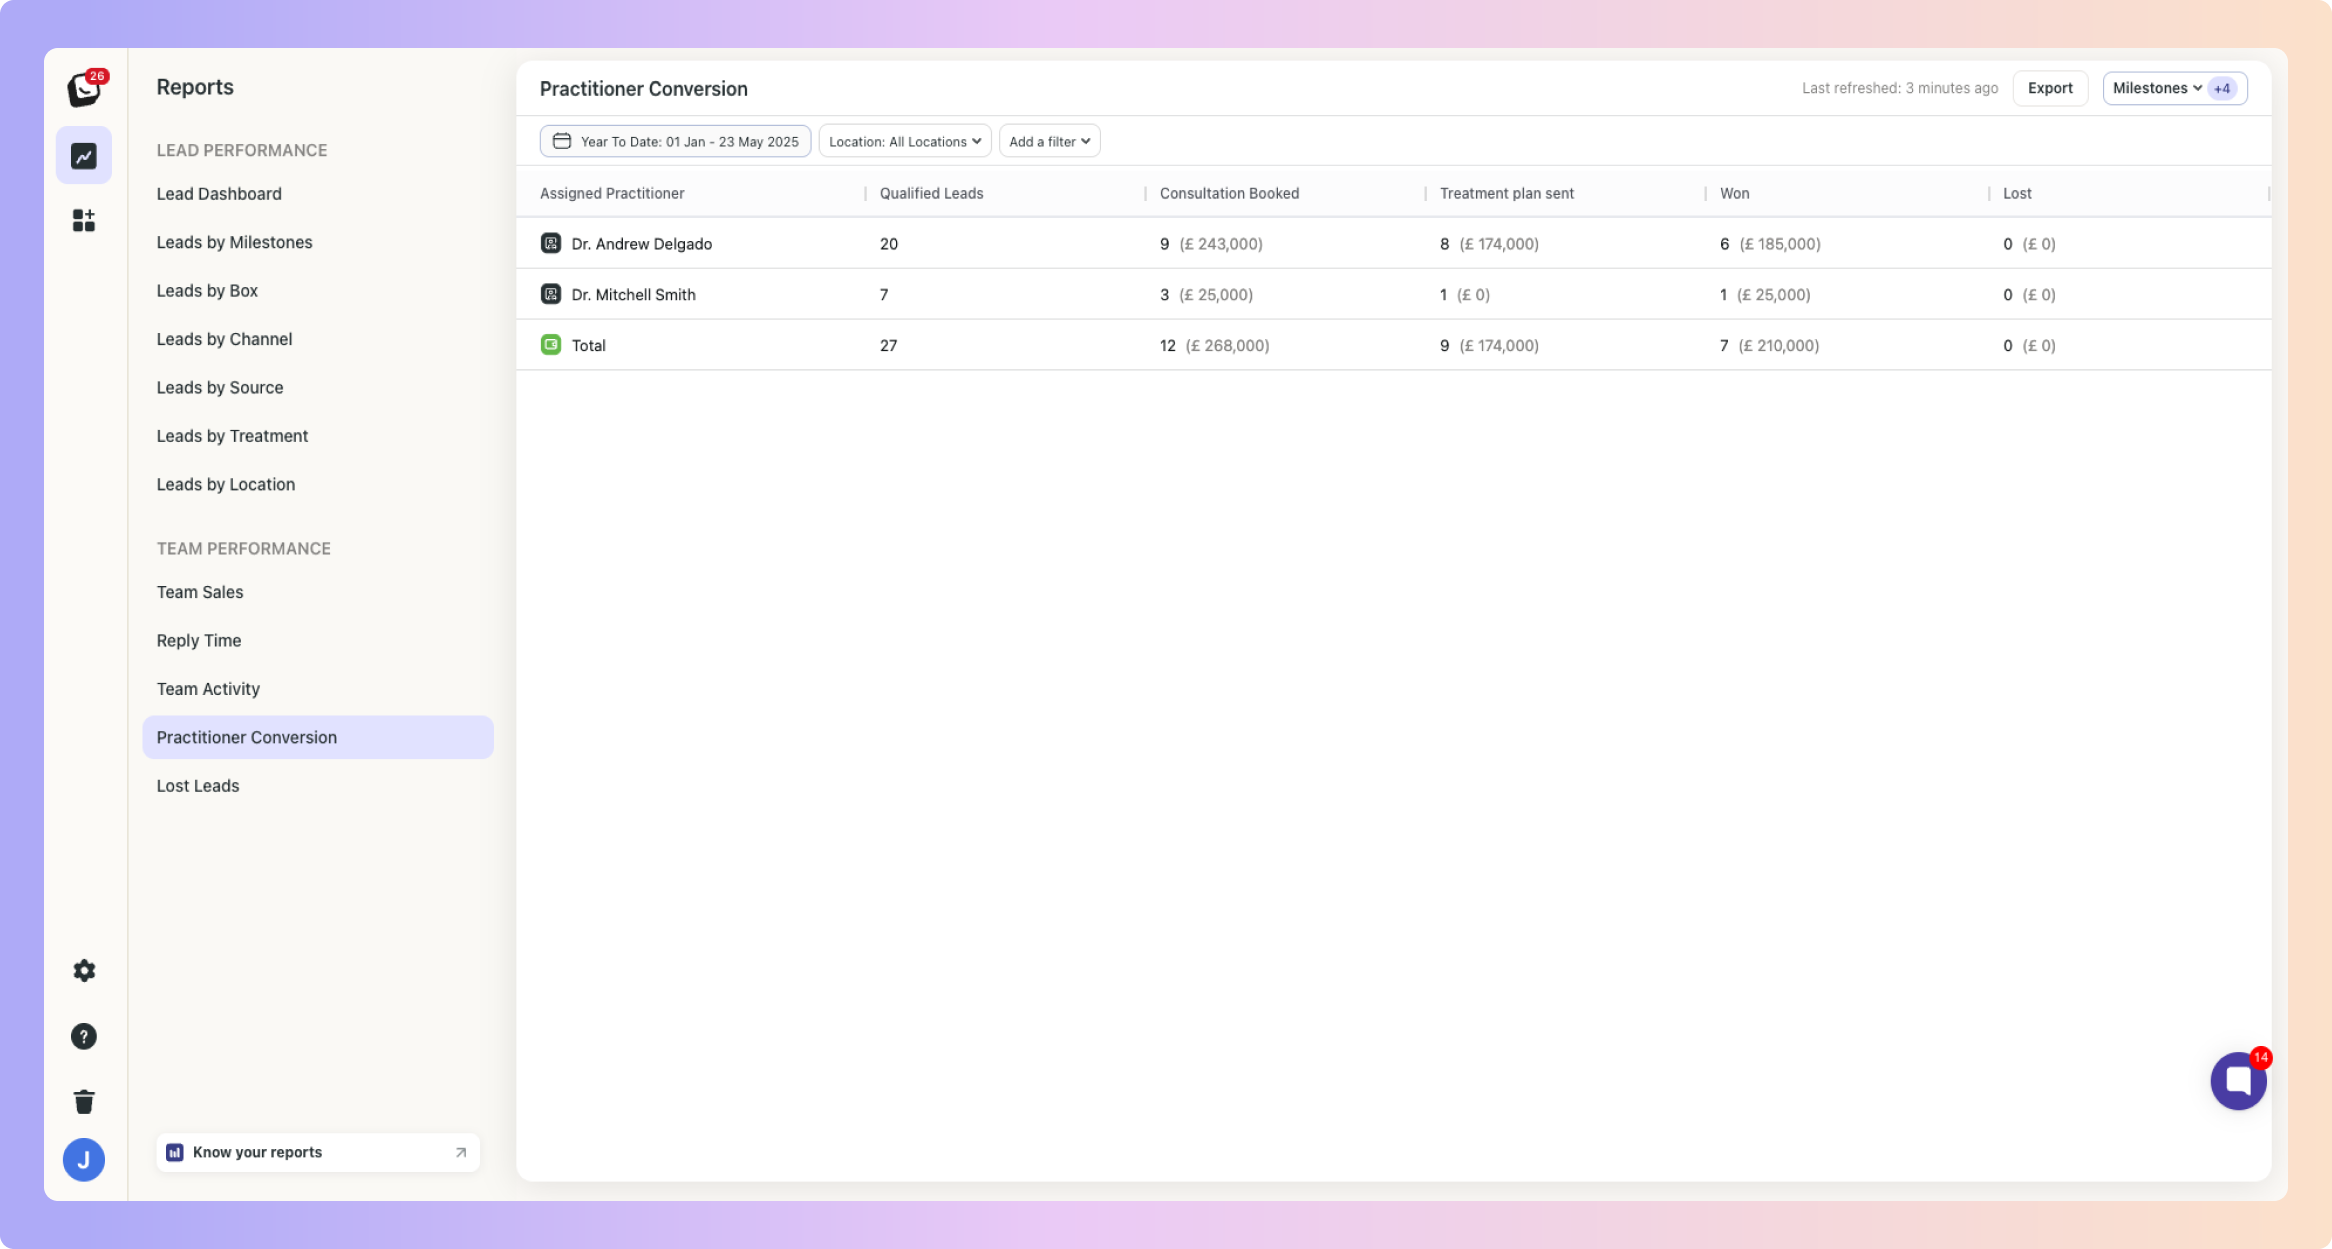
Compare how different practitioners perform across your funnel, using milestone tracking.
👉 Read More about the Practitioner Conversion Report
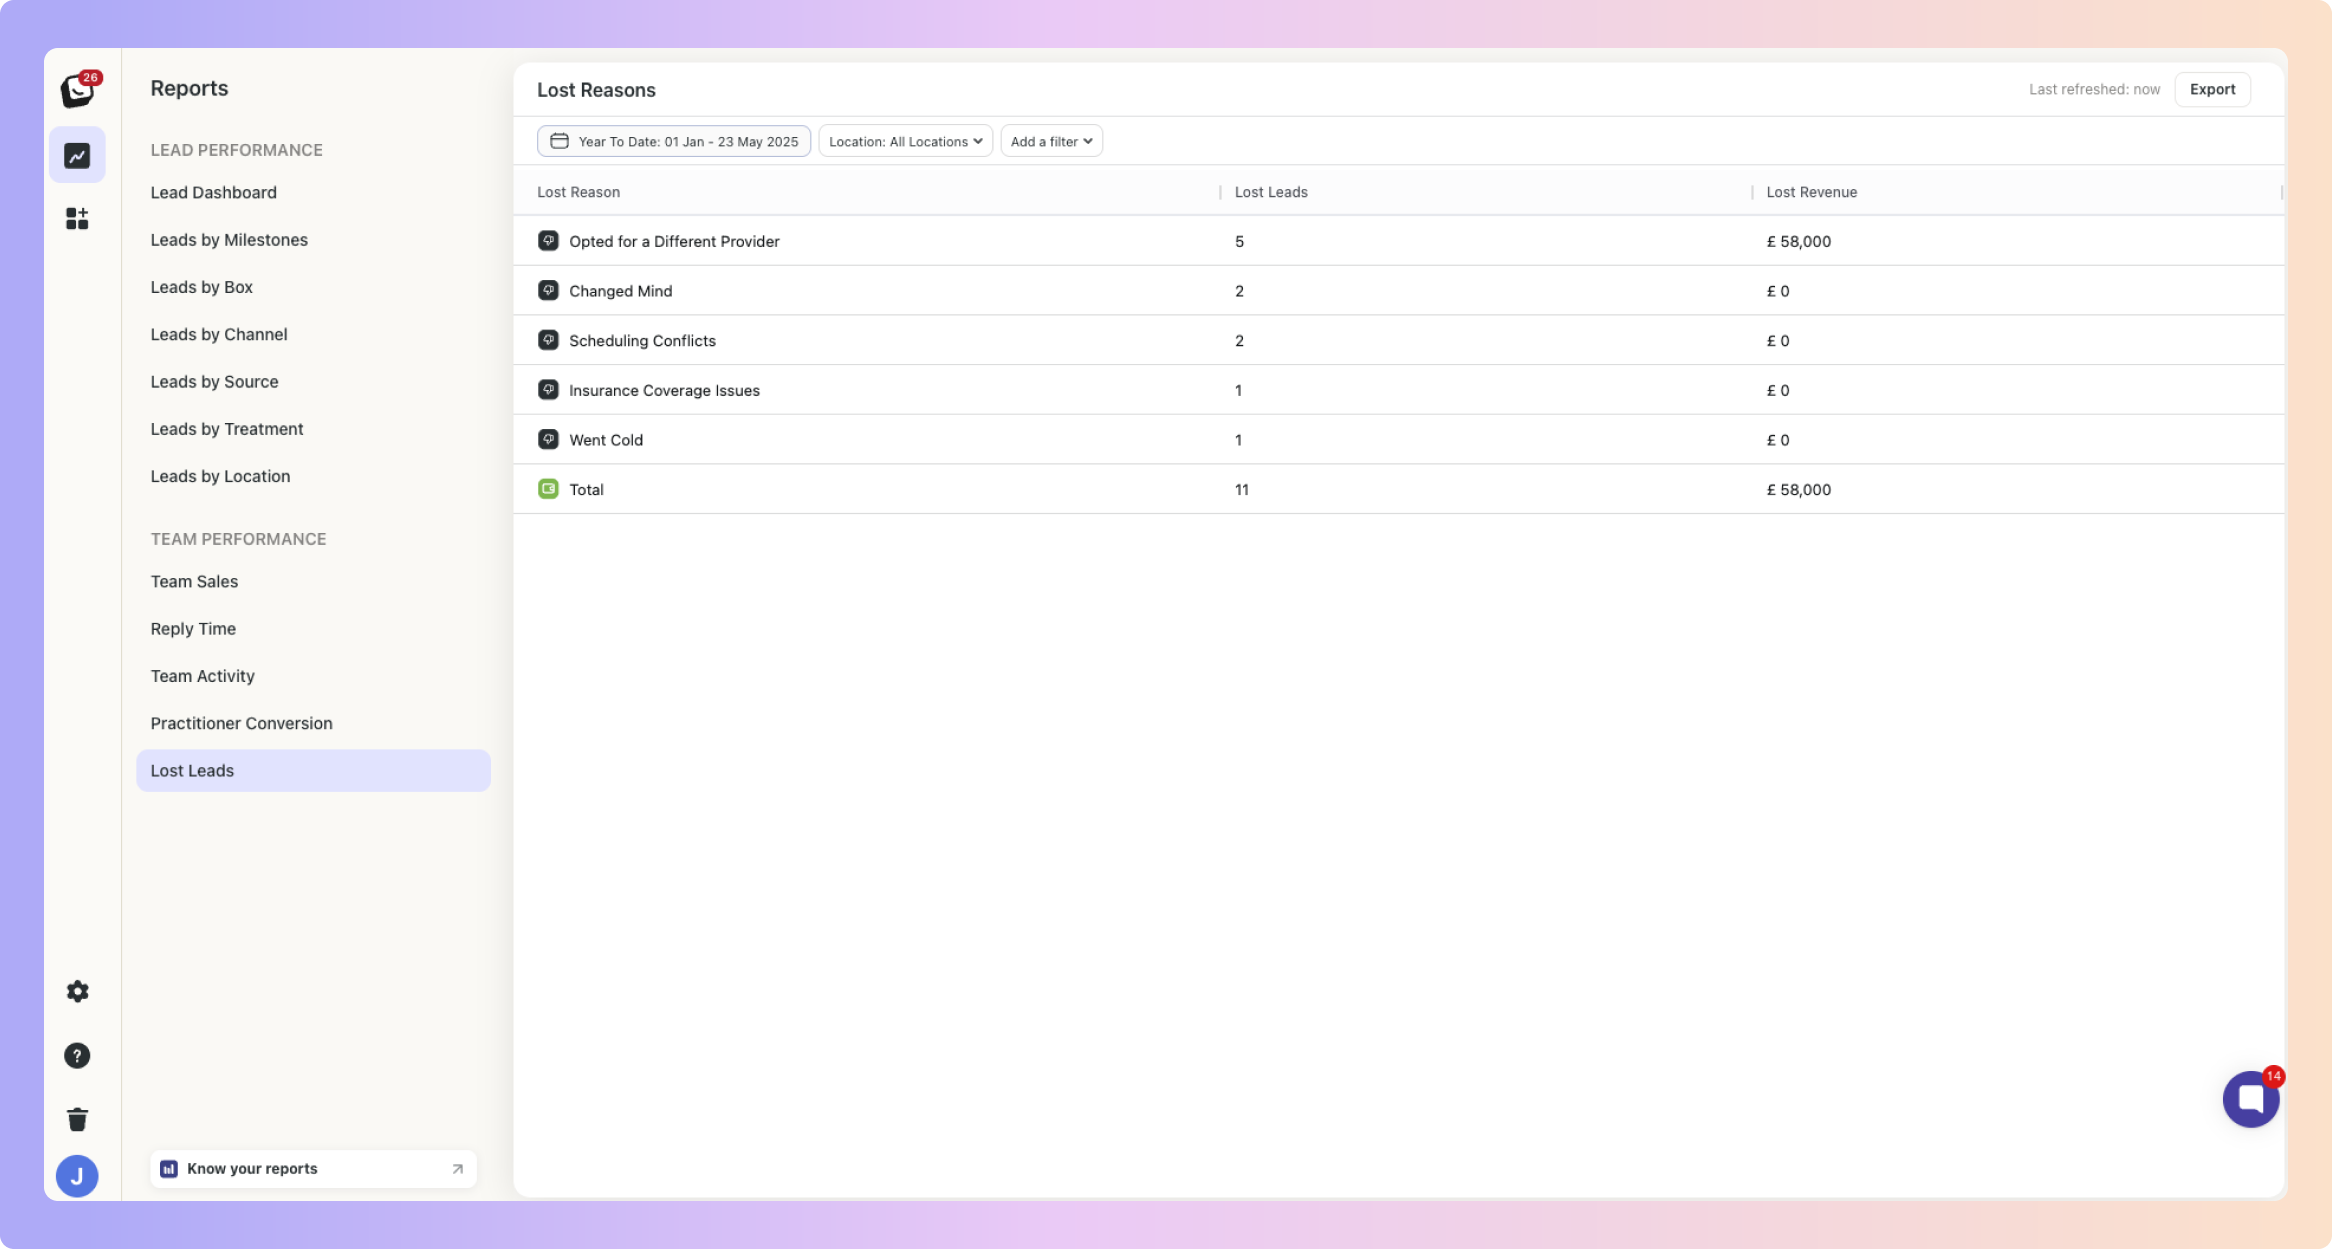
Understand why leads didn’t convert and where value was lost. This report includes sub-reason tracking, you’ll have a deeper understanding of why your leads drop-off than ever before.
👉 Read More about the Lost Leads Report
We’ve updated how often reports refresh so data stays up-to-date and the system runs faster.

Refresh every 10 minutes:
Lead Dashboard
Leads by Channel / Source / Treatment / Location / Referral
Lost Leads
Practitioner Conversion
Refresh every 1 hour:
Leads by Milestone
Leads by Box
Refresh every 4 hours:
Team Sales
Team Activity
Reply Time
🧠 Example: If a new lead comes in or moves stage, the Lead Dashboard will update within 10 minutes. Team Sales reports will update every 4 hours.
You can find our Help Centre here it is always available, and you will find a wealth of resources and support.
You can also contact our Customer Success Team for any further assistance at [email protected] but rest assured you and your team should find everything pretty straightforward to set up.